GCSE Physics Resistance of a Wire
GCSE Physics Resistance of a Wire
Before starting my coursework I have decided to chose a factor that will affect the resistance of a wire.
I shall do this by going through all of the factors that affect the resistance of a wire and how I would
measuring each factor to find out which would be the most effective and easiest factor to measure.
Below is a list of factors and reasons why they affect the resistance of a wire. From this list of factors I
shall only pick one factor to investigate. To explain the how the factors would affect the resistance of a
wire I have drawn a diagram to show how resistance occurs.
WIRE
ATOMS=
ELECTRONS=
Resistance occurs when the electrons travelling along the wire collide with the atoms of the wire.
These collisions slow down the flow of electrons causing resistance. Resistance is a measure of how
hard it is to move the electrons through the wire.
Factors
.Temperature : If the wire is heated up the atoms in the wire will start to vibrate because of their
increase in energy. This causes more collisions between the electrons and the atoms as
the atoms are moving into the path of the electrons. This increase in collisions means that
there will be an increase in resistance.
2.Material : The type of material will affect the amount of free electrons which are able to flow through
the wire. The number of electrons depends on the amount of electrons in the outer energy
shell of the atoms , so if there are more or larger atoms then there must be more electrons
available. If the material has a high number of atoms there will be high number of electrons
causing a lower resistance because of the increase in the number of electrons. Also if the
atoms in the material are closely packed then the electrons will have more frequent collisions
and the resistance will increase.
3.Wire length : If the length of the wire is increased then the resistance will also increase as the
electrons will have a longer distance to travel and so more collisions will occur. Due to this
the length increase should be proportional to the resistance increase.
4.Wire width : If the wires width is increased the resistance will decrease. This is because of the
increase in the space for the electrons to travel through. Due to this increased space between
the atoms there should be less collisions.
To chose which factor I am going to investigate I am going to consider how I would measure each
factor and which factor would be the best and easiest to record.
To measure the wire width I would use different widths of the same length and same material of wire
e.g. thin , medium and thick copper wire with thin and thick constantin wire. To record the difference
in widths I would use the same voltage and measure the resistance for each thickness. Although it
would be easy to obtain and record the data the graphs that I would be able to draw up would not be
interesting.
For the temperature of the wire I would not be able to carry out a fair test because it is extremely
difficult to produce and control the range of temperatures needed without the correct equipment.
If I chose to measure the difference in the resistance in different materials I would chose a number of
different materials and using the same voltage I would record the resistance given by each wire of the
same length and width. Although once again it would be simple to record these results the graphs that
could be drawn would not show any connection between the material and the resistance because of the
limited number of materials I could test with the equipment available.
The final factor is the length of the wire. To measure and record the findings for this factor would be
simple and the results collected could show a connection between the length of the wire and the
resistance given by the wire. This is why I have chosen to investigate this factor.
Prediction
I predict that if the length increases then the resistance will also increase in proportion to the length. I
think this because the longer the wire the more atoms and so the more likely the electrons are going to
collide with the atoms. So if the length is doubled the resistance should also double. This is because if
the length is doubled the number of atoms will also double resulting in twice the number of
collisions slowing the electrons down and increasing the resistance. My graph should show that the
length is proportional to the resistance.
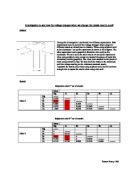
The diagrams below show my prediction and should explain it more clearly:
Because the length of the wire is only half the length of the wire below there should be half the number
of collisions between the electrons and the atoms.
The wire below is twice the length of the wire above and so there should be twice the number of atoms
resulting in twice as many collisions and a predicted doubling of the resistance.
Preliminary Method
In this preliminary experiment I will select a wire that will be used in my main experiment when
investing the connecting between the length of the wire and the resistance of the wire.
To ensure a fair test whilst carrying out my preliminary experiments I am going to be very careful
when selecting my independent variables which are the width of the wire and the wire material. I am
going to use a constant voltage of 2 volts and a constant length of 50 cm.
Apparatus: Meter ruler ¡V To measure the wire being tested to ensure a fair test.
Selection of wires ¡V Different materials and widths but the same length.
Crocodile clips ¡V To connect the wire being investigated to the rest of the circuit.
Voltmeter & Ammeter ¡V To measure the resistance.
Wires ¡V To connect the above items and to complete the circuit.
To measure the resistance of the wire I am going to use the equation RESISTANCE=VOLTS
CURRENT I will obtain the voltage and current readings from the voltmeter and ammeter.
Below is a circuit diagram for my preliminary experiment.
POWER SUPPLY
2 VOLTS
AMMETER
VOLTMETER
CROCODILE CLIPS
WIRE
METER RULER
To ensure a fair test I shall keep the power supply at 2 volts and I shall keep the length of the wire at 50
cm.
Preliminary Results
Below is a table of results which I have collected from my preliminary experiment.
WIRE VOLTS (v) AMPS (A) RESISTANCE (Ohms)
THICK COPPER 0.3 5.13 0.06
MEDIUM COPPER 0.6 4.20 0.14
THIN COPPER 0.9 3.13 0.29
STEEL 0.7 1.20 0.58
MEDIUM CONSTANTIN 1.0 0.41 2.44
THIN CONSTANTIN 2.7 0.49 5.51
From these results I have chosen to use thin constantin for the wire I am going to use in my main
experiment. I have chosen this wire as it has the highest resistance and so it will be easier to notice any
difference in resistance in my main experiment
Main Method
Before I start my main experiment I have chosen to do a risk assessment which is shown below.
Risk Assessment:
"h I will handle the power supply carefully.
"h I am going to only use a voltage of 2 volts.
"h I will be careful when handling live wires.
Apparatus: Power Supply
Ammeter
Voltmeter
Thin Constantin wire
Meter Ruler
Crocodile Clips
Connecting Wires
I have chosen to use thin constantin wire because from my preliminary results I found that this wire had the highest resistance, because it has the highest resistance it will be easier to measure any change in resistance.
To collect the data for my graph I have chosen to take a range of 5 lengths. I have chosen a range of 5
as to plot an accurate graph I will need at least 5 points to mark on the graph . I have also chosen to
take 3 repeats at each length and then take an average. I have chosen this so that if I have any
anomalous results they will not show when I plot the averages on the graph. The lengths that I have
chosen are as follows : 20cm , 40cm , 60cm , 80cm and 100cm. I have chosen these lengths because
they are easily measured by the meter ruler and give a good range.
Below is a circuit diagram of the circuit I am going to use in my main experiment:
POWER SUPPLY
2 VOLTS
AMMETER
VOLTMETER
CROCODILE CLIPS
WIRE
METER RULER
In my main experiment instead of using an ohmmeter I have chosen to use an ammeter and voltmeter ,
I have done this so that instead of relying on the ohmmeter to give the resistance I will calculate the
resistance of the wire , I shall calculate the resistance of the wire using the equation below.
RESISTANCE = VOLTS
AMPS
I have chosen to use a meter ruler because the lengths that I will be measuring are to big for a smaller
ruler and also the meter ruler can be accurate to +1mm or ¡V1mm.
Results
Below is a results table with the results that I collected from my main experiment.
LENGTH 200 mm 400 mm 600 mm 800 mm 1000 mm
VOLTS (v) 1.6 1.5 1.6 1.7 1.7 1.7 1.8 1.8 1.8 1.9
.8 1.8 1.9 1.9
.9
AMPS (I) 0.608 0.609 0.607 0.351 0.352 0.351 0.237 0.238 0.238 0.184 0.184 0.184 0.148 0.149 0.149
RESISTANCE
(Ohms) 2.6 2.5 2.6 4.8 4.8 4.8 7.6 7.6 7.6 10.3 9.8 9.8 12.8 12.8 12.8
AVERAGE
RESISTANCE
(Ohms)
2.6
4.8
7.6
0.0
2.8
From these results I have drawn a graph of the length of the wire and the resistance of the wire.
Analysis
From the graph on the previous page I can see that the resistance of the wire is proportional to the
length of the wire. I know this because the Line of Best Fit is a straight line showing that if the length of the wire is increased then the resistance of the wire will also increase.
Conclusion
In my prediction I said that :
¡§¡K.if the length increases than the resistance will also increase in proportion to the length.¡¨
From my graph I have shown that my prediction was correct, as the Line of Best Fit is a straight line proving that the resistance of the wire is proportional to the length of the wire.
The length of the wire affects the resistance of the wire because the number of atoms in the wire increases or decreases as the length of the wire increases or decreases in proportion.
The resistance of a wire depends on the number of collisions the electrons have with the atoms of the material , so if there is a larger number of atoms there will be a larger number of collisions which will increase the resistance of the wire. If a length of a wire contains a certain number of atoms when that length is increased the number of atoms will also increase. This is shown in my diagrams below:
Electron
Atom
In this diagram the wire is half the length of the wire below and so has half the number of atoms, this means that the electrons will collide with the atoms half the amount of times.
Also if the length of the wire was trebled or quadrupled then the resistance would also treble or quadruple.
Evaluation
From my results table and graph I can see that my results that I collected are very reliable. I know this because my results table does not show any individual anomalous results this means that I did not have to leave any results out of my averages because they were anomalous. Also on the graph I can see that none of the averages plotted are anomalous because all the averages lie along the same straight line.
During my experiment I have noticed several modifications I could make to improve on the Investigation if I was to repeat it.
The first of these modifications would be the circuit that I would use. To be more accurate with my results I would use the circuit layout below:
POWER SUPPLY
2 VOLTS
AMMETER
VOLTMETER
WIRE
METRE RULER
Instead of connecting the voltmeter to the main circuit I would connect it to the wire which is being tested. I would do this so that the voltmeter is measuring the voltage of just the wire being tested and not the wires of the main circuit as well.
To also improve on my results I would use a digital voltmeter instead of an analogue meter. I would do this because a digital voltmeter is a lot more accurate than an analogue because if the needle in the analogue voltmeter is bent then the readings given off will be false whereas a digital voltmeter does not rely on a needle or any other manual movements.
The next modification I would make would be to use pointers instead of crocodile clips , I would do this because pointers would be more accurate. The pointers would be more accurate because the tips have a much smaller area than the crocodile clips giving a more accurate measurement of the length of wire.
As well as making these modifications I would also improve my Investigation by testing the same wire but different widths of that wire. I would do this to expand on my Investigation.
An investigation to find how mass and force effect acceleration
Method
In this experiment I aim to find out how the force and mass affect acceleration. I shall do this by setting up an experiment involving a ticker tape timer and trolley, to keep the experiment as fair as possible I will only change one variable at a time. For the first part I will only vary the force (see fig. 1) in difference weights of 1N, 2N, 3N and 4N. In order to keep the friction acting on the trolley constant I will make the ramp which the trolley is on at the exact angle so it would keep moving at constant speed if I pushed it, this simulates no friction. Also I will keep the mass of the trolley constant by weighing it on a top pan balance. Finally the ticker timer was kept at constant time intervals.
Aswell as varying the force I decided to vary the mass of the trolley in masses of an extra; 100g, 200g, 300g and 400g. However as in the first part I have to keep the other variables constant, the force pulling on the trolley must stay at 1N and in the same way as before also the friction and time intervals. Another thing that I would usually take into consideration is that the experiment should be repeated to give better results, however this is not important because the ticker timer and trolley give very accurate results.
After setting up the apparatus to give fair results I will carry out four sets of ticker timers for the force and then for the mass of the trolley. These will then give me a series of ticker tape charts which I will be able to transfer onto an acceleration against force graph and acceleration against mass graph.
Prediction
I predict that the force will be proportional to the acceleration and so will also the mass will be proportional to the acceleration. However not in the same way, as the force increases the acceleration will increase but as the mass increases the acceleration will decrease.
Planning
Safety: There are a few safety precautions that we need to take, such as making sure that the weights, when they came down, do not hit anyone who may be passing, or on our own feet. Another precaution is making sure that the weights on the trolley are securely placed, or fastened, to the trolley, so that they do not come off from the trolley and cause injury.
Equipment: I will need a special ramp with elastic at one end, books to put under the ramp to get elevation, but the elevation must be so that it is a friction/gravity compensated. A trolley, a ticker timer and tape. String to tie the falling weights to the trolley. Weights with 100g masses on, and also masses of 1kg for the trolley.
Fair test: Making sure that the tests are fair is quite a major factor in our experiment, because we have to keep all the experiments the same i.e the method in which we do it has to keep the same.
Predictions: I predict that the more kilograms that are put on the trolley, the slower the trolley will go down the ramp.
Procedure: When the equipment is set out as above then we will tread some ticker tape through the ticker timer and Cellotape the end to the trolley. I will put the trolley at its starting position (at the start of the ramp) and then when I am ready I will start the ticker timer and start the trolley down the ramp, and when it reaches the end I will stop the ticker timer.
I have decided to take measurements of 2 newtons pulling the trolley down (which will always stay the same) and then change the different weights on the trolley itself, from nothing up to 4 kilograms, which include 1kg, 2kg, 3kg and 4kg. So in all I will do 5 experiments and therefore have 5 different graphs.
We have not really done any previous experiments like this one apart from in the FY we did some experiments like these using the ticker timers and tape, and so before I started I knew roughly what was to be expected.
Evaluating Evidence
I think that the procedure which I used was the best that I could have done, partly because the results I got were very good. On looking at my results I can tell that they are quite good because the line of best fit goes roughly through the top of all the results. Also the acceleration of the trolley became less the more weight was put on.
The method that I used was quite a reliable one and there were not very many problems that occurred from carrying out the experiment, the only slight improvement that I would do, which may not actually affect my results very much would be if, as I did, you took the readings in two different lessons and then used two different trolleys, the trolleys may run differently and so the readings will be different, but as I said it may not affect the graphs too much.
But apart from that the method that I used was completely successful.
From looking at my results I can see that the graph where there is 1 kilo gram
on the trolley the last piece of ticker tape is out of place because the other pieces of tape match up roughly to the line of best fit whereas the last one is equal to the previous piece of tape before that. This could have been caused by a number of things such as something may have very slightly obstructed the trolley on its way down the ramp, or perhaps the trolley got up to a constant speed and so would go no faster. Or possibly it was just a freak reading. If I was allowed to repeat any experiments again then I would definitely repeat this experiment, to get a full set of correct results. When I was working out the acceleration, for that experiment I did not include this piece of tape and so I only divided the number I got by seven rather than eight. I think that this was a good idea because is meant that my results kept almost perfect and it did not affect the acceleration at all.
My prediction was completely correct because I said that the more weight that was put on the slower the trolley would go, and I have enough evidence to confirm that my prediction was correct.
Analysing evidence and conclusion
We can conclude that the more weights that are put on the slower the trolley goes down the ramp. The reason for this statement to be true is because the more weight that is put on the trolley the more downwards force is exerted on the trolley, and the force is greater than gravity and so it goes slower down the ramp than it would do if I had no weights on it. It also causes more friction between the ramp and the wheels of the trolley and so therefore goes even slower down the ramp. My results compare very well with my predictions because I said that the more weights that were put on the trolley the slower it would go and as my results showed I was correct.
SC1
Physics
Investigation into the stopping distance of a toy car
Planning
Aim
My aim is to set-up and carry out an experiment to investigate the stopping distance of a toy when the speed of the car is varied.
Factors which will effect the stopping distance of the toy car.
) The mass of the car will effect the stopping distance of the car due to the effects of friction that will increase as the mass of the car increases. Therefore the stopping distance of the car will shorten as ...
This is a preview of the whole essay
SC1
Physics
Investigation into the stopping distance of a toy car
Planning
Aim
My aim is to set-up and carry out an experiment to investigate the stopping distance of a toy when the speed of the car is varied.
Factors which will effect the stopping distance of the toy car.
) The mass of the car will effect the stopping distance of the car due to the effects of friction that will increase as the mass of the car increases. Therefore the stopping distance of the car will shorten as the mass increases.
2) Speed of the toy car effects the stopping distance because it has more energy to carry it further and to overcome frictional force therefore greater speed should mean greater stopping distance.
3) Aerodynamics will effect the stopping distance because the more aerodynamic the object in this case the toy car the less drag or air resistance will be produced therefore a greater stopping distance will be achieved.
4) The surface on which the car is to stop on will effect the stopping distance. Because, for example if the road surface is textured, it will require more energy from the car to overcome friction from the rough surface therefore this car will not travel as far as on a non-textured or smooth surface.
5) Also all other frictional forces will effect the car like the surface area of the tyres on the car. The friction between the axle and the chassis. Also the amount of friction will increases with temperature of the surface and the tyres.
6) Gravity, although I will be unable to vary this in my experiment, it would effect the friction between the car and the road therefore would increase the stopping distance of the car if you could decrease the gravitational pull on the car.
I am going to investigate the effect that the speed the car is travelling has on the stopping distance. I have chosen this to be my variable because it is the easiest to vary and the others are the easiest to keep constant therefore it is less likely to produce errors in the results.
Procedure
I will use the same plastic toy car, which will keep the mass, aerodynamics, and other frictional forces mentioned about the car constant. I will use the friction between the car and the surface, which will be a reasonably smooth table, as a breaking force. Increasing the height of a wooden ramp using wooden blocks of 10mm will vary the speed of the car. At the base of the ramp a light gate will be set up, and on top of the toy car, attached with plasterseen, there will be a 100mm piece of card, this will be used to control or trigger the light gate.
I will vary the height of the ramp using the blocks, which in turn will vary the speed of the car. I will measure d that will be equal and kept constant at 100mm.
Therefore to find the speed of the car I will use the formula:
Speed = Distance (d) of card / time on light gate
Then I will measure the stopping distance from the base of the ramp.
I will repeat the readings 3 times and find the average stopping distance over 8 different speeds. A preliminary test showed that the maximum height or blocks is 8 because after that the front of the car hits the table to hard and it doesn't result in an accurate increase from the height or speed before.
Qualitative Prediction
I predict using simple common sense and logic that the cars stopping distance will increase as the speed of the car or height of the ramp are increased. I think this will happen because by increasing the ramp size and therefore increasing the speed of the car you are increasing the amount of K.E., Kinetic Energy that the car has. Therefore having more energy to overcome frictional forces acting on the car will result in a larger distance cover, or larger stopping distance.
Also the law of conservation of energy says that:
Loss in KE of car = Work done by frictional forces
Or 1/2 MV2 = F x D
Therefore if F (frictional forces) is assumed as constant then
D = (1/2 M/F) V2
But I think that F will change through out the experiment because of heating effects on the axles of the car and wheels. Because as the car increases in speed it will therefore turn the axles faster and this means that the axles will come in contact with the chassis more often therefore generating more friction between the axles and the car, I think that F will change.
So D ? V2
I.e. stopping distance is proportional to (speed) 2
So if speed is doubled i.e. v = 2v; stopping distance will quadruple
Because
D ? V2
D ? (2V) 2
D ? (4V)2
SC1
Obtaining Evidence
Result Table of Experiment
This is an anonymous result because all the others are above 530 but this result is below 500. This is an error. To ensure accuracy through out the experiment I repeated any results when the car hit the ruler or the light gate. When we increased the speed to a certain amount the car gradually curved towards the ruler, which it eventually hit. Due to this fact I had to ensure the car was let go of straight down the ramp and not at any slight angle. This was very hard to keep constant because the angle of the car looked straight enough to the eye but was probably out.
Also to ensure accuracy we had to make sure we looked down as close to a 90-degree angle as possible when measuring stopping distances off the ruler, this might of caused error in the results. We also used a separate ruler to measure across from the front of the car to the meter ruler, this was also hard to keep at a right angle to the car because the bonnet of the car was curved. Sometimes I accidentally pushed the car when carrying out this operation and therefore repeated that measurement. Also we had to ensure that the light gate was positioned correctly. The car had to pass through on the flat table and not at an angle. If it did pass through at an angle, this would of created an error in the results, because the amount of card that passed through the light gate would be more than if it was at an angle rather than on a flat table. Therefore 'd' or distance which was required to work out the speed would not been kept constant and therefore would of caused an error in the results.
SC1
Analysis
The information presented here in graphs shows clearly that as you increase velocity the stopping distance of the car increases.
Conclusion:
I conclude that with reference to the graphs that frictional force increases as you increase the velocity. This is shown in graph 2 where velocity increases in a curve not a straight line, therefore there is another variable involved, e.g. friction.
SC1
Evaluation
The method could be improved considerably because there is too much room for error when conducting the experiment. Although the results were fairly reliable and gave reasonable graphs there could be areas that could be improved within the method. There was one identifiable anomaly, which has been high highlighted in the obtaining section. This anomaly could have been caused by an inaccuracy when doing the experiment, this could have been caused by accidentally pushing the toy car when letting it go down the ramp. Or also the car might of passed through the light gate at a slight angle and therefore increased the value for the distance, this would of caused an error.
The method used was fairly reliable as I used a light gate to measure the speed, which is much more accurate than other methods, which would involve manual timing.
But also there are a lot of things that could be improved for example-using blocks to support the ramp could have caused an error because they might not have been exactly 10mm thick, therefore causing an inaccurate increase in height. This would probably not of showed up in the results, also the positioning of the ramp was often moved this could of altered the angle o the ramp which could of caused error. One of the most obvious changes which could be improved is the release of the car down the ramp this was done by hand which would have caused inconsistencies in results. Another part of the method that needs to be improved is the act of measuring the stopped distance of the car. This also was done by hand which could cause significant error because of the inaccuracies involved with looking down at the ruler and reading off a value. To improve the point made about releasing the car I would set up some sort of clamp with a solenoid to release the car electronically therefore eliminating any human error. Also stopping distance could be measured electronically by using several hundred tiny lasers or light gates set up in millimeter intervals, just like a ruler along the area where the car would run. Or there could be tiny magnets set up along the ruler and a reed switch attached to the side of the car and as it passed along side the ruler depending on how many times the reed switch was broken it would calculate a distance. Then a measurement could be digitally read of a display, which would eliminate any human error in looking at a ruler. But these ideas are far too unpractical to do at school and would be very time consuming to set-up. Also to improve on the height adjustment of the ramp could be done using pneumatic pistons to lift the ramp up and down to the exact height wanted.
Investigate the loss in mass of the anode when a copper
Investigate the loss in mass of the anode when a copper
sulphate solution is electrolysed
These are the input variables that I believe could affect this investigation:
Surface area of electrode
Temperature of electrode
Time
Current
Molarity of copper sulphate solution
Outline plan
I have chosen to investigate the variable of current, and its effect on the loss of mass at the anode. Therefore, to maintain a fair test I will have to control the rest of the variables above. Through pre-testing I have learnt of an effective method to record results. Here is the equipment I have selected:
This set up ensures that a circuit is maintained at all times. The electrons will flow from the power pack to the cathode. The copper ions will then gain electrons here to become copper atoms. At the anode the copper atoms will decompose to release electrons and complete the circuit. The copper ions will be released into the copper sulphate solution, which is why the anode loses mass (for more detail look to my prediction).
The anode will be weighed and the result noted each time. Then the equipment will be set up as shown above and each value in the range shall be tested. I will start the stopwatch and then try and keep it at the correct current using the stopwatch. The electrodes will then be dried, and the anode weighed once more, noting the result. This procedure will be repeated at each current three times, then I will move on to test the next current until the investigation is complete. The results will be noted throughout.
I learnt about the equipment set up from Nelson's CHEMISTRY by John Holman. I found that using a power pack instead of a battery was better because it gave me a higher range of amps to test. Batteries usually give a lower voltage, limiting the range of amps. Initially, I was also going to use a boss and clamp to hold the electrodes in place. However, I found it was extremely difficult to grip them. It was much easier to simply clip them to the edge of the beaker, which also helped with another aspect of the experiment, as mentioned further on.
Through pre-testing I learnt about appropriate values to test. The first set up I tried was at an 8 V setting on the power pack. Using the variable resistor I achieved 0.7A and I timed the experiment for five minutes. These values were fairly suitable, however, I learnt that movement affected the current. The current jumped from 0.7A to 0.3A in seconds. This would certainly make an inaccurate test, so to correct this error I used crocodile clips to hol smaller.
From pre-testing I also learnt about a limit to the range of current values I could test. The variable resistor only allowed a current of 1A maximum. With this knowledge I decided upon a range of five values: 0.2A, 0.3A, 0.4A, 0.5A and 0.6 A. I think it is important to test five different values because when plotting a graph this will give me a more clear and accurate trend that is not likely to be coincidental. From pre-testing, I also found these values more suitable because it seemed as though the higher the current the more it varied. Therefore, I knocked 0.7 A off the top of the range and added 0.2 A at the bottom.
Throughout the investigation a fair test has to be maintained, to avoid bias results. For this reason, it is important to keep the surface area of the electrodes the same because the greater the surface area the greater the loss in mass. This is because at the anode the copper atom is decomposed into a copper ion and two electrons. The copper ion is dissolved into the solution. When the electrode has a larger surface area it means there is more surface for the copper ions to dissolve into the solution from. Therefore, the loss of mass in a set time will be greater. To ensure that this will not bias my experiment, the same electrodes will be used each time.
In the same way, a layer of oxide on the copper electrodes may also give the anode less surface from which the copper ions can dissolve. To ensure that this bias is minimal, the electrodes will be sandpapered and chemically cleaned each time they are used.
It is also important to keep the temperature of the electrodes the same each time because when the electrode is hot, they will expand, once again increasing surface area and making my results bias. To make sure that this will have no affect when I conduct the experiment I will always do the experiment at room temperature away from the window. This means that the outdoor weather will not affect it either.
Time is also an input variable. If I varied the time it would also vary the amount of current that will pass through both electrodes, and current is directly proportional to the loss in mass at the anode. This is because with a greater charge, the copper at the anode has to decompose more to give more electrons. To make sure that the time has no affect on the loss of mass at the anode, I will time each experiment for three minutes only. This way it will remain the same in each test and will not affect my results.
I have considered what affect the solution's coverage of the anode has, and I think it is also important to keep this controlled, as this will also affect the loss of mass at the anode because the solution is the circuit's connection between both electrodes. If it only covers half of the anode, only half of the anode will be able to transfer its copper ions and therefore the loss in mass will be far less. Therefore, to eliminate chances of this bias I will use the same length electrodes each time and clip them at the top of the same sized beaker. As the volume of the electrolyte will always be the same as well, it should mean that coverage shall remain the same.
I believe it is also important to keep the circuit in DC (direct current) throughout the investigation because with AC (alternating current) the current will keep changing direction. This will affect which electrode is the anode and which is the cathode. If the initial anode starts losing mass due to the lack of electrons, it will gain them back again when the current changes direction because this electrode will now be concentrated with electrons. Therefore, the mass of the anode will keep changing and the anode will keep changing electrode. Therefore, to avoid this confusion, I will simply use DC.
****It is important to keep the molarity of the copper sulphate solution the same. This is because the greater the molarity of the solution the more copper ions there are available to take the electrons from the cathode. The faster that the electrons are taken from the cathode, the faster the copper at the anode decomposes to give the same number of electrons. This therefore means that the molarity of the copper sulphate solution affects the loss in mass at the anode. To avoid this bias I will keep the molarity of the solution at one each time.
Finally, my experiment set up ensures that the electrodes will not touch at any point on the experiment. This will bias the results because there will be no contact with the solution and therefore the electrodes will not gain or lose mass because they will not come into contact with the copper ions in the solution. They will always be clipped at opposite parts of the beaker and if they do come into contact, I will re-do the result.
It is also important to maintain an accurate test because this will enable me to see a clearer trend. To ensure that I get accurate results I will measure time to the nearest millisecond. Liquid will always be measured in the smallest cylinders possible, to enable me to get it closer to the mark required. I will always use 200 ml of copper sulphate solution. It will also be measured to the nearest millilitre, which is a more accurate unit. I will repeat each result three times so that I can get a better idea of the correct results and exclude odd results. The weights recorded for the anode will be measured by an electronic scale, which is more accurate, and to the nearest milligram.
I will ensure a safe test by keeping the glass beakers away from the edge. My hands will be dry at all times when coming into contact with the electricity, and all wires shall be insulated while all plugs shall be earthed. The wires will be kept off the floor to avoid tripping up, and I will keep a clean area to work with which will minimize accidents and breakages as well.
Prediction
I predict that the greater the current the greater the loss in mass at the anode. To explain how I have come to this conclusion, I will first explain what is happening in the circuit:
Electrons flow from the power pack to the cathode.
The copper cations are attracted to the negatively charged cathode by an electrostatic force.
The electrons complete the outer shells of the copper atoms.
(Cu2+(aq) +2e Cu(s))
At the anode there is a need to balance the current of electrons going into the power pack with the number going out.
5. To do this, copper is decomposed at the anode to release enough electrons.
(Cu(s) Cu2+(aq) +2e)
6. The copper ions go into the solution and the electrons continue around the
circuit. Therefore the loss in mass is the weight of the copper atoms decomposed. The current remains the same all around the circuit.
Current is the measure of the number of charges that pass a point per second (C/s). Therefore if you increase the current, there will be more electrons available at the cathode to make copper atoms. So with greater current the mass at the cathode will increase. This in turn means that at the anode there will be a greater loss in mass as current increases, because the copper will need to decompose more and match the number coulombs being pumped out of the power pack.
I expect that the loss in mass at the anode will be directly proportional to the current. To explain why, I will first write out the ionic equation at the anode:
Cu (s) Cu2+(aq) +2 e
Every copper atom loses two electrons and a copper ion at the anode, so one mole of copper atoms goes to two moles of electrons plus one mole of copper ions. The current is a measure of how many electrons flow through the circuit in a given time, so if the time is kept constant, the current only affects the number of electrons passing. Therefore, the current would only affect the number of copper atoms decomposed, and their combined mass. In fact, if the mass of copper required is doubled, the current must be doubled to allow double the number of electrons to pass through the circuit in the same amount of time, thus losing twice the overall mass. If 63.5g (~1 mole) of copper atoms must be decomposed at the anode in one second, a current of 193,000 amps would be needed. This is given by using Faraday's law and Faraday's constant.
Faraday's Law:
Current (I) = Charge (Q) / Time (T)
Faraday's Constant:
mole of electrons have about 96,500 coulombs of charge.
Cu2+(aq) + 2e- Gives Cu(s) 1 mole + 2 moles Gives 1 mole 1 mole + 2 x 96,500 Gives 63.5g
I = Q / T Q = 2 x 96000 Coulombs T = 1 Second I = 2 x 96,500 / 1 I = 193,000 Amps So for every 193,000A, one mole of copper atoms will be decomposed. Therefore, if I know that the current will be directly proportional to the loss in mass at the anode, I can predict the shape of the graph:
Knowing these equations and the relative atomic masses from the periodic table, I can calculate the exact losses in mass at the anode. I will show the method I use for one calculation and then just calculate the rest. This is how you would calculate the loss in mass at 0.2A:
. Figure out the ionic equation: Cu Cu2+ + 2e
This means that 193,000 C are needed to make one mole of copper (Faraday's constant)
Therefore, them amount of current that is actually put into the circuit needs to be calculated using the formula 'charge = current x time': charge = 0.2 x 180. This means that the charge passed through the circuit is 36 coulombs.
To calculate how many moles of copper is lost with only 36 C you divide the 36 C by 193,000. This gives 0.0001865 (4 sig fig) moles
By multiplying the number of moles by the relative atomic mass you can calculate the loss in mass: 0.0001865 x 64 = 0.012g (2 sig fig)
Therefore this is my prediction at 0.2A. I will use exactly the same procedure to calculate the other results, but changing the input current every time.
Loss in mass predictions:
Current
(in amps)Loss in mass prediction
(in grams)0.20.0120.30.0180.40.0240.50.0300.60.036
I have calculated each of the mass losses to the nearest 2 significant figures.
Obtaining Evidence
The equipment I used to make my measurements was an ammeter and weighing scales to weigh the anode each time. I also used measuring cylinders to measure the volume of copper sulphate solution. The apparatus I used for accuracy was small measuring cylinders. An electronic scale ensured that there was no human error involved in weighing, and it measure to two decimal places, which is quite accurate. The stopwatch measured in milliseconds and the current was measured in milliamps to ensure accuracy.
These are the results that I obtained when following the procedure detailed in my plan. I did each result three times to give accuracy and make it easier to spot a general trend and the anomalous results.
Experiment 1
Current
(in amps)Weight of anode before experiment
(in grams)Weight of anode after experiment
(in grams)Loss in mass at anode
(in grams)0.20.340.330.010.30.470.440.030.40.430.420.010.50.490.470.020.60.530.540.01
Experiment 2
Current
(in amps)Weight of anode before experiment
(in grams)Weight of anode after experiment
(in grams)Loss in mass at anode
(in grams)0.20.370.370.000.30.330.320.010.40.320.280.040.50.280.280.000.60.270.260.01
At this point in the investigation, the anode was getting so thin that it broke. Therefore, to get one final experiment, I selected a new electrode of the same length and width and used this as the anode for the rest of the investigation. Here are the results:
Experiment 3
Current
(in amps)Weight of anode before experiment
(in grams)Weight of anode after experiment
(in grams)Loss in mass at the anode
(in grams)0.021.011.000.010.031.000.950.050.040.950.880.070.050.880.830.050.060.830.820.01
Now I have calculated the averages of each of my results using the mean method. Here are the results:
Current
(in amps)Loss in mass at the anode
(in grams)0.020.0060.030.0300.040.0400.050.0230.060.010
Analysis
From my investigation I have found out that the greater the current, the greater the loss in mass at the anode which is as predicted. (For scientific reasoning view my plan). Although this is the general trend, two out of the five results still did not fit.
This is clearly visible from the graph I have drawn. The reason why I think that they do not fit is because they had a greater current variation than the 0.2A, 0.3A and 0.4A I tested. At 0.6A certainly, despite trying to change the voltage and resistance throughout, the current at two minutes had come down to 0.2A. This was certainly an unfair test. The same applied at 0.5A. During the test, it reduced to about 0.25A despite putting the voltage on the power pack to the maximum. This meant that the results were not really fair, and because they had a less current than they should have, the mass lost at the anode was less than it should have been. The reason why I believe that this happened is because at the greater current, the anode was decomposing more and putting more copper ions into the water in a set time than at a smaller current. This means that the copper ions could get slowed down when moving towards the cathode. If at the cathode less electrons were being given to the copper ions. Then at the anode less copper atoms would be decomposed to pass electrons further around the circuit. Therefore, the current would keep decreasing.
Also, from my graph I can see that at 0.2A the anode lost less mass than it should have. I believe this is because I conducted the experiment by testing 0.2A to 0.6A, then re-doing the results from 0.2Ato 0.6A once more. This meant that I only had to adjust the voltage and resistance very slightly while timing to get to the next correct current. (Remember- the stopwatch started as soon as the power switch was turned on and then the correct current was obtained). Therefore, when I re-did results I had to change the current from 0.6A to 0.2A as quickly as possible while the time was going and often I went too low for a bit and then finally up to the correct current in the first ten seconds. This could affect the results because it meant for part of the test the current was lower than it should have been, and therefore the loss in mass at the anode was less than it should have been. (View my prediction for scientific reasoning).
The results at 0.3A and 0.4A are greater than they should be according to the best-fit curve on my graph. I think this is because these currents are greater, and often with a greater current the temperature of the components increase since the electrons vibrate more. This energy can be transferred to the atoms of the electrode and cause it to heat up. I know that with a greater temperature there will be a greater loss in mass, (for scientific reasoning view plan).
I can also see from my graph that my best-fit curve is steeper than the predicted best-fit curve. I think this is also because of the heating effect of current, which is why at 0.2A my result would have been correct with my prediction since there be minimal heat produced from 0.2A. However, as the current increases I can see that the best-fit curve gets further from the prediction because as the current increases the electrodes would heat up more and more making the results greater and greater than they should have been with the same temperature throughout.
Despite all these errors, my results still show that current is directly proportional to the loss in mass at the anode, which is demonstrated by the best-fit curve. For scientific reasoning view my prediction.
In conclusion I feel that my predictions have been supported by investigation. However, not completely since two of the five results still go against my prediction. Also, the general trend of my results does not fit the mass loss predictions I made. However, I have tried to explain why. This evidence mostly supports my theory.
The Electrolysis Of Copper Sulphate Solution Using Copper Electrodes
Planning
I did some preliminary work to see which current values, and for how long to time. The results of this are in the tables below:
Electrode-1A Mass before (g) Mass after (g) Mass change (g)
Anode 1.38 1.30 -0.08
Cathode 1.35 1.65 +0.30This was done for 10 minutes. The mass lost at the anode should equal the mass gained at the cathode, which this doesn't, it has a percentage inaccuracy of 0.22¸ .30x100= 73% which is very inaccurate, This may be due to the current being too high, so the copper does not all transfer properly, but lies on the bottom of the beaker, therefore a lower current must be used, as in the table below:
Electrode-0.1A Mass before (g) Mass after (g) Mass change (g)
Anode 1.42 1.35 -0.07
Cathode 1.16 1.21 +0.05This was also one for ten minutes, and shows much more accurate results, as the percentage inaccuracy is only 0.02¸ 0.07x100=29%, which is still inaccurate, but is a lot better . This could be due to the current value being to low, so I will take a range of 5 results from 0.1Amp to 1Amp at 0.2Amp intervals. Each electrolysis will last 10 minutes, and each will be repeated twice so that a more accurate average can be taken.
Variables
* Temperature of the electrolyte
* The concentration of the electrolyte
* The separation of he electrodes
* The size of the electrodes
* Current
Only the mass or size of the electrodes, and the current are being investigated, therefore in order for this to be a fair test, the other factors must be kept constant. The temperature was monitored during the preliminary results, and the higher the current the higher the temperature change, which in the 1A reading was 5º C, therefore to keep it as constant as possible the current will be as low as possible, and monitored, so that it does not change during the experiment There will be a thermometer in the electrolyte so that the temperature can be monitored. The same CuS04 will be used throughout so the concentration is the same, and the same spacing between electrodes will be used. The size of the electrodes should be the same, but they will be reused, so the size will change from experiment to experiment.
Method
* scrub copper electrodes with wire wool
* rinse in distilled water
* dry with propanone
* weigh and record anode and cathode
* put into circuit ate set current value, with crocodile clips, making sure the clips are not touching the copper sulphate.
* time for ten minutes
* remove and dry, weigh and record result
The Electrolysis Of Copper Sulphate Solution Using Copper Electrodes
Method and Obtaining Evidence
Diagram
Obtaining evidence
Current (amps) Anode before (g) Anode after
(g) Mass loss
(g) Cathode before (g) Cathode after (g) Mass gain (g)
0.2 1.39 1.36 -0.03 1.33 1.38 0.05
0.2 1.35 1.31 -0.04 1.37 1.40 0.03
0.2 average 1.37 1.34 -0.04 1.35 1.39 0.04
0.40 1.29 1.20 -0.09 1.40 1.48 0.08
0.40 1.20 1.18 -0.02 1.47 1.57 0.10
0.40 average 1.25 1.19 -0.06 2.87 1.35 0.09
0.60 1.01 0.91 -0.10 0.98 1.11 0.13
0.60 0.98 0.89 -0.09 0.92 1.06 0.14
0.60 average 1.00 0.90 -0.10 0.95 1.09 0.14
0.80 0.91 0.75 -0.16 1.11 1.27 0.16
0.80 0.72 0.57 -0.15 1.25 1.41 0.16
0.80 average 0.82 0.66 -0.16 1.18 1.34 0.16
.00 0.70 0.54 -0.16 1.20 1.03 0.17
.00 0.68 0.55 -0.13 1.18 1.35 0.17
.00 average 0.69 0.55 -0.15 1.19 1.19 0.17
The Electrolysis Of Copper Sulphate Solution Using Copper Electrodes
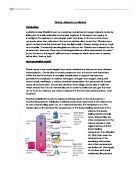
Analysis
There are two straight lines of best fit through the origin , the red one is the mass gained at the cathode, and the pencil one is the mass lost at the anode. The lines are nearly as they should be, which is equal, as the mass lost at the anode should equal the mass gained at the cathode. This is because as explained in the planning, the reaction occurring at the anode,:
Cu(s) (r) Cu2 +(aq)+2e- (oxidation)
during the electrolysis of a copper salt is the reverse of the cathode reaction:
Cu2 +(aq) + 2e- (r) Cu(s) (reduction)
So for every two electrons passing through the external circuit, one copper ion should be formed at the anode and one copper ion discharged at the cathode. One would expect the mass loss of the anode to equal the mass gain at the cathode, as explained earlier, for every two electrons, at the cathode one copper ion is discharged, whilst at the anode, one copper ion is formed This can be explained with the ionic theory, which basically states that the electrons flow away from the cathode, to the anode where the Cu2+ ions take 2 electrons from the negative electrode and become Cu atoms, thus mass loss at cathode = mass gain at the anode. This does support the prediction, as the two lines are at most only 0.018 grams apart, or 10% inaccurate, using the formula difference ¸ theoretical X 100. The other pattern is that the mass change µ current, This is shown by the construction lines on the graph, which show that when the current is 0.2A, the mass lost at the anode is 0.035g, and the mass gained at the cathode is 0.04g, and when the current doubles to 0.4A, the mass change also doubles as the mass lost at the anode is 0.07g, and the mass gained at the cathode is 0.078g. This is because, as explained in the planning section, The amount of copper deposited on the cathode and lost from the anode depends on the number of electrons passing through the circuit, i.e. upon the charge passed through the cell. Now the charge passed, q (in Coulombs), is related to the current. I ) in amps) and time, t (in seconds), by Faraday's law:
q=ixt
As t is a constant at 10min, then q µ i. My results support this as the greatest error was only 0.01g, or 12.5%.
Evaluation
There were several sources of error in this experiment as none of the results were 100% accurate. These error could have been caused by the fact that not all the ions "stick" to the anode, and so end up at the bottom of the solution. This happens most at higher levels of current, and causes the mass lost at the cathode to be greater than the mass gained at the anode. Also the temperature of the solution raised at higher currents by 5° C This would cause less ions to turn to copper at the anode, and make the current more, as there is less resistance. The size of the electrodes was also never exactly the same, as they were reused, so the amount of electrolysis differed from experiment to experiment. The separation of the electrodes was a small source of error, as they were not always exactly the same distance apart. The current which was controlled with the rheostat was not always the same, as the amount of copper decreases, so does the resistance, and so the current increases. Other errors could have been caused by the apparatus, such as the ammeter, which is quite old, and may not be perfectly calibrated, and the scales, which only show the mass to 2 decimal places. The rest are cut of with out rounding. Therefore this experiment could have been made more accurate by using lower current values, with the same size and separation of electrodes, controlling the current so that the temperature is constant, and the current more accurately controlled, and using a more accurate ammeter and a balance which rounds the other decimal places. My results showed many inaccuracies, shown by the accuracy bars on the graph (green for anode, and red for cathode). Which show the highest value and the lowest, with the average in the middle. This shows that for the 0.20A reading, the anode difference is 0.01A, and the cathode difference is 0.02A, both very small variations. For the 0.40A reading, the anode difference is 0.07A, a much greater difference, and the cathode variation was smaller, at 0.02A. The 0.60A anode difference was only 0.01A, and the cathode was the same. The 0.80A anode and cathode variation were also 0.01A. The final reading, 1.00A anode difference was 0.03, and the cathode variation was 0A. This nearly fits the pattern of the greatest variation being at the top, except for the 1.00A cathode variation of 0A. This increasing variation is caused primarily by two things, firstly the temperature of the solution increases more at higher current values, so the ions travel faster, and so do not stay on to the anode as well, and secondly the increased current itself has the effect of making less ions sticking to the cathode. The anomalous result for in the 0.40A value for the anode was probably caused by one or both of the crocodile clips touching the solution, so less electrons flow through the copper, and so less are transferred to the cathode.
The range of my results were from 0.20A to 1.00A, with an average discrepancy of 0.02A from the average reading, which although there was one large anomalous result is quite small, is quite a small variation, therefore The evidence is strong enough to say that the mass lost at the cathode equals the mass gained at the anode, and that q µ i, as the greatest error was only 0.01g, or 12.5%.
If This experiment was to be done more accurately, I would have to use more accurate apparatus, such as a newer ammeter, a balance with more digits, a more accurate way of controlling the current, maybe with a computer, and likewise with the temperature. I also could have kept the size and separation of the electrodes the same. I also could have made sure that the crocodile clips were completely out of the electrolyte. Also I could have taken a much wider range of readings, from 0.01A to 10A at smaller intervals, and I could have timed for different times, and I could have investigated the other variables, such as the temperature of the electrolyte, the concentration of the electrolyte, the separation of he electrodes, and the size of the electrodes. The Electrolysis Of Copper Sulphate Solution Using Copper Electrodes
Planning
Electrolysis is the decomposition of a substance by the passage of an electrical current. I a typical set up, two electrodes (conducting rods immersed in an electrolyte). Voltage is applied to the electrodes with a power pack. The electrolyte must be an ionic compound that is molten or in aqueous solution, in order for it to conduct electricity.
Electric current is caused by the movement of charged particles. In a normal circuit, theses charged particles are electrons, which are effectively pumped through the metal wire by the power pack. In the electrolyte these charged particles are mobile ions. At the electrodes electrons are given to the cat ions cathode (-), and are released at the anode (+), so the current flows. Therefore species are gaining electrons at the cathode, and so being oxidised, whilst electrons are taken away at the cathode (reduction).
At the cathode there is preferential discharge of ions according to the position of the element in the reactivity series. When aqueous copper salts are electrolysed, the cat ions present is he solution are hydrogen ions, which come from the water, and copper ions, so copper is formed at the cathode.
Cu"(aq) + 2e-> Cu(s)
At the anode the reaction occurring depends on the nature of the electrode. If the electrode is inert, then normally it is found that the ions are discharged in the order halide then hydroxide before sulphate. However, this order may change depending on concentration. An example of this is platinum electrodes. Those made of carbon behave similarly, but a carbon anode will react with oxygen as it is released forming oxides of carbon, like in an aluminum smelter. Copper electrodes are not inert, instead of incoming anions being discharged, the copper goes into solution:
Cu(s)> Cu" (aq) + 2e-
The reaction occurring at the anode during the electrolysis of a copper salt is the reverse of the cathode reaction. So for every two electrons passing through the external circuit, one copper ion should be formed at the anode and one copper ion discharged at the cathode. So overall copper is being transferred from anode to cathode, as is exploited in electroplating and in purifying copper. One would expect the mass loss of the anode to equal the mass gain at the cathode, as explained earlier, for every two electrons, at the cathode one copper ion is discharged, whilst at the anode, one copper ion is formed. Also the concentration should remain constant.
The amount of copper deposited on the cathode and lost from the anode depends on the number of electrons passing through the circuit, i.e. upon the charge passed through the cell. Now the charge passed, q (in Coulombs), is related to the current. I )in amps) and time, t (in seconds), by Faraday's law:
q=ixt
therefore I will predict that the mass change of the copper electrodes is directly proportional to the current and the time.
Factors which will effect the mass change of the electrodes are:
* Temperature
* Concentration
* Distance between electrodes
* Size of electrodes
These factors may alter the resistance of the circuit, so they must be kept constant to keep the experiment a fair test.
Safety
* Copper sulphate solution is poisonous, so must not be taken internally, or come in contact with the eyes.
* Propane is highly flammable, so must be kept away from flame. Damages eyes and skin, so safety glasses must be worn.
Method
Copper sulphate solution is electrolysed using clean copper electrodes which are weighed before and after use. To make sure that copper are dry and clean after use, they are rinsed in distilled water, and then propane. During the electrolysis, the current is controlled and maintained at a constant value by a rheostat in the circuit. Five current values in the range 0-1.25A are used, each for a period of 10 minutes, repeating each value three times to improve the accuracy of the results.
Enzymes and Temperature
Plan: the idea of this experiment is to find the optimum temperature of the chemical enzyme Methylene blue. I will do this by mixing the enzyme with yeast in a test tube and sitting this in the water. The water will be a certain temperature so that the mixture sits in a certain temperature eg.40.c for the whole experiment. (See diagram) I will time this until the blue colour has completely gone from the mixture, this will then tell me how fast the chemical enzyme works at this temperature. I will try this at six different temperatures this will then hopefully tell me what or where round about the optimum temperature is. I will try to stay between 20.c and 60.c because below or higher than this barrier the enzyme will not work quickly and or will be denatured. I will use 2cm3 of glucose, which is mixed with 2cm3 of yeast to form the yeast and glucose part. And this mixture is kept in a different test tube to the 2cm3 of Methylene blue until they have both reached the required temperature in the water at that time they will be mixed and the test started. In doing this I am seeing how fast the enzymes g to work and how the temperature affects its performance. To make this into a fair test I will keep everything in these experiments the same accept the temp. I will do each temp 3 times then will find an average of these to go on to my graph. My 6 temperatures are 20.c, 30.c 40.c, 50.c, 60.c and 70.c. I have chosen these temps so that I have a wide range of results.
Diagram:
Prediction: I think that the enzyme will work best at 45.c to 50.c I think this because that optimum temperature for most natural enzymes is 40.c but his is a chemical enzyme so it will work best a little higher. If this temp is exceeded then I think that it will take longer to work because it will not be at the optimum temp, or it will not work at all because it has become denatured. An enzyme cannot recover from this state. Below this temperature I think it will be slowed down but will not denature because it can't at low temperatures only at high ones. These will not be to reliable so I may have to use a different set of measurements when I do it but for now it will be these.
Fair test (how): I made this a fair test by only changing one thing in the experiment; I will only change the temperature. I will keep all these things the same,
· The amount of yeast+ glucose and the amount of Methylene blue.
· The amount of water used.
· The apparatus, test tube, beaker, thermometer and timer.
· I will use the same batch of methylene blue and yeast +glucose.
I will keep all of these things the same in order to do a fair test.
Scientific theory: I know that the more common enzymes work best at around 40.c. This is there optimum temperature. If this temperature begins to rise the reactions slow down, this will continue to happen until the enzyme is denatured. It becomes denatured at around 60.c, this happens because the enzyme becomes misshapen. This means that the enzyme will no longer work because it will no longer fit, the active site will be ruined. The enzymes react like a lock and key, only one lock fits the key. When the two join then you get the chemical reaction. When too much heat gets applied then the lock gets changed and so the key doesn't fit the lock so there is no reaction. (Better explained in my picture)
Key when joined the reaction starts,
Active site (lock)
This reaction will not work because the
Key lock doesn't fit the key. This will never
work again.
Active site (lock denatured)
As you can see as soon as the lock gets denatured it wll no longer work.
Preliminary work: I watched someone else do this experiment and saw how it was to be done. This helped me see how the experiment worked and how to do things correctly. I also have done a lot of work on enzymes in lessons and know how they work which has helped me understand this process.
Results:
Temperature in .c 1st time in minutes 2nd time in minutes 3rd time in minutes Average time
20
30
40
50 10+
60 10+ 10+ 10+
70 10+ 10+ 10+
There are too many negative results because the enzyme is denaturing too quickly, so as I thought I would have to narrow my temperatures to, 20.c, 30.c, 40.c, 45.c, 50.c and 60.c. This is my new results table.
Temperature in .c Time taken in seconds 1st time Time taken 2nd time Time taken 3rd time Average time in seconds
20 532 542 524 532.6666667
30 304 252 314 290
40 153 157 152 154
45 147 139 141 142.3333333
50 256 259 251 255.3333333
60 1000 1000 1000 1000
From these results I can see that my prediction was wrong because the optimum temperature for this enzyme was around 45.c. I think that this is true because you can tell from my table and my graph. I think that this happened because it wasn't a natural enzyme it was a chemical one. This enzyme denatured at around 60.c.
Conclusion: from doing this experiment I have found that the chemical enzymes work best at a slightly higher temperature than the natural enzymes do. You can tell that this is true by looking at my graph or table. The chemical enzyme that I used, methylene blue, worked best at 45.c unlike the natural enzymes that work best at around 40.c.
Evaluation: if I were to do this experiment again I would use the most sophisticated equipment available because you can't record things well enough yourself. I would use a constantly heated water bath that was always at the correct temperature and I would use an electric thermometer too. I would do this and I would make sure everything was perfect before every temperature was recorded. I would also change my variations in the temperature so that I had a clearer idea of the exact optimum temperature. I would record no denatured results. These are all the changes that I would make.
Investigation on yeast
Apparatus
Spatula, glucose, yeast, boiling tube, 250ml beaker, delivery tube, measuring cylinder, watch, test tube rack, tray.
Diagram
Method
We set up the equipment as shown in the diagram. The beaker of warm water was not present at the start of the experiment but was added at the start of the 13th minute when there was no visible reaction. We counted how many bubbles per minute were released.
Minute Number of bubbles released
2345678910111213141516171819202122232425262728293031323334353637383940Total 000000000000021100322733333210000000000036
Conclusion
The rate of respiration increases gradually before reaching its peak. It then decline steeply as all of the material has reacted. If the experiment had of continued then there would be no more bubbles as all of the material has reacted. The results support this theory.
Evaluation
Accuracy- There are many inconsistencies in the results. For instance my theory that the results climb gradually higher before peaking sometimes disagrees with a result or two, instead of climbing gradually higher it drops by one or two. This could be because the temperature of the water in the bath varies with room temperature or that some gas escapes through a leak in the apparatus. This causes the curve to fluctuate.
Reliability- In general the results agree with each other however one or two anomalies cause the curve to look strange in the build up to the highest point however the main steep point of the graph is correct. Although we can not be completely sure whether or not this is what happens as the experiment only worked for a few people I believe that my theory is correct. To check this we could perform the experiment more times under better conditions.
Anomalous Results- Because of the anomalous results the graph is not perfectly as it should be. They could happen because of a leak. The seal between bung and test tube may not be air-tight. This would cause the gas produced by the reaction to escape through the leak and therefore there would be only few bubbles if any.
To prevent this you could smear a layer of Vaseline around the edge of the join between bung and tube. This would fill any cracks and stop the leak. If the temperature of the water was varying then we could use an insulative material as a cover for the beaker with a hole for the test tube in the centre.
The depth of the delivery tube in the beaker would affect how many and how quickly the bubble were released as the more pressure pressing down on the tube with increasing depth would make it harder for the bubbles to escape.
We should remember not to count the bubbles that appear as the tube is inserted into the water as they are just the air being pushed out.
Improvements- In order to improve the experiment we could choose a liquid that is not affected by temperature as much. We could insure that the delivery tube was at a fixed depth for each experiment and we could make sure that all of the yeast had been mixed in and was not on the side of the tube thus affecting the results. As said above the seal could be made with Vaseline.
Photosynthesis
Photosynthesis is a very important process in nature. It is the production of energy in the form of glucose involving water from the soil, carbon dioxide from the air and light energy. It takes place in all green plants, which use the green chlorophyll, held in chloroplasts in the leaves, to trap light. The main site of photosynthesis is the palisade mesophyll cells in the leaf of a plant. It is these cells that contain the green chloroplasts and are very well adapted to their task. They are near the upper side of the leaf where they can obtain the maximum amount of light, they are packed very closely together and as already mentioned contain green chloroplasts clustered towards the upper side too.
Plants photosynthesise to produce food chemicals that are needed to allow them to grow. The main reaction is to produce oxygen and glucose to be changed into energy during respiration. Glucose is stored in the form of starch which is insoluble and does not affect the osmosis taking pace in the plant. As plants respire both day and night this starch is often used up during the night when photosynthesis cannot take place. The uses of glucose within the plant are for active transpiration, cell division, the production of protein and the production of cellulose. However many other things can also be produced with the addition of special mineral salts.
In photosynthesis the raw materials are carbon dioxide and water. They react to form the products of the reaction-oxygen and starch (glucose that has been stored). The reactions need energy and this comes from light. The green chloroplasts allow light to be used as energy and therefore both of these things are like helpers in the reaction. Glucose is formed firstly then turned into starch to be stored up for when it is needed.
Although photosynthesis is a complicated process it can be summed up in this equation:
6CO2 + 6H2O C6H12O6 + 6C2
carbon dioxide water glucose oxygen
It is important to the reaction that certain factors are present when it is occurring. We know that these are carbon dioxide, water, light and chlorophyll. Without these the reaction will not take place at all, but some of them also determine how quickly the reaction takes place. Water, carbon dioxide and light, along with temperature, all have a particular effect on the rate of photosynthesis. In terms of carbon dioxide the levels in the atmosphere do not really alter very much, but if gardeners wish to increase the rate of photosynthesis then sometimes carbon dioxide is pumped into greenhouses. Up to a certain point as temperature goes up so does the rate of reaction. After it reaches a certain point though the enzymes involved in the reaction become denatured and stop working properly. A drop in the amount of water present may cause photosynthesis to occur at only half the normal rate. The reason for this is the stomata are being closed.
The final factor which contributes is light. We decided to investigate how this affects the rate of reaction also.
METHOD
We need to find out how the of presence light and the intensity of it contributes to the rate of photosynthesis. To be able to measure the rate we need some type of visible sign that photosynthesis is actually taking place. We will use a type of plant that grows in water and produces bubbles when photosynthesising. By counting these bubbles we can tell how fast oxygen is being given off and therefore produced from photosynthesis. We will place the pondweed in a beaker containing water and also a bit of sodium hydrogen carbonate-NaHCO3-(0.5%). This is put in as it acts as carbon dioxide. If it wasn't there then another limiting factor may be the cause of the rate changing instead of just light.
By placing the beaker next to a lamp we can alter the light intensity. We will move the lamp further away every time and then count the number of bubbles that are produced within one minute. The weed will be given two minutes each time to adjust to the new level of light intensity. To start with the lamp will be 1cm away from the beaker, then the following distances:
2cm
4cm
8cm
6cm
The diagram will help to explain this more clearly.
The rate of reaction will be in number of bubbles per minute (b.p.m).
VARIABLES AND CONSTANTS
The factor that will be changed is light intensity. This is the only factor that will be changed. The factors that will be kept constant are the amount of water the weed is put in, carbon dioxide levels, lamp that is used and temperature. This means that out of all the possible factors we have chosen only one to monitor.
PREDICTION
I predict that as the light intensity is increased the rate of photosynthesis will also increase. However at a certain point the light will reach a certain point where the rate will not increase any more. The chloroplasts will no longer be able to absorb any light so the rate will stay at its optimum level or even decrease. At this point light is no longer limiting.
The graph of results will probably look something like this:
Light is limiting at this point Maximum rate of photosynthesis
light is no longer limiting.
RESULTS
DISTANCE-CM
145 240 189 145 240 189 148 146 222
2 130 210 127 130 210 127 125 130 183
4 97 150 114 97 150 106 118 106 816
8 55 60 40 14 60 45 76 94 600
6 8 5 1 8 5 4 40 48 30
The last set of results is very anomalous and we won't be using it for our results.
And here are the averages of these results.
DISTANCE-CM NUMBER OF BUBBLES PER MINUTE
180.25
2 148.63
4 117.25
8 55.5
6 14.88
ANALYSIS
This is a graph of the averages. The light intensity for the distances used will be shown in the following units:
cm- 1000 units
2cm- 250 units
4cm- 62.5 units
8cm- 15.6 units
6cm- 3.9 units
As you can see our results have turned out quite similarly to how we expected. In the first table of results there are some slightly different results according to the different experiments that were done. This shows that it can't have been 100% reliable. It does prove however that as light intensity is increased the rate of photosynthesis is increased also. This is because the more light there is available the more light the chloroplasts can absorb. They use this light in the reaction as energy; therefore the more energy there is available the faster the reaction can take place.
EVALUATION
On the graph there wasn't a point where the rate started to level off. We assumed that this would happen, as the chloroplasts would not be able to absorb any more light energy. However this did not happen so it may be that we did not take the pondweed close enough to the light so it would reach a point where the rate could no longer increase.
There was one set of results in the first table that I decided to leave out. These results were very unusual and anomalous so to include them would have greatly affected the average. I felt it was best to leave them out so they would not give us results that were inaccurate.
These anomalous results, among others, can be explained by many things. First off all our experiment was not completely fair. We did not attempt to regulate the temperature as well as we could have done which as we know is a limiting factor of photosynthesis. We could have put the test tube into a beaker filled with water of a certain temperature. This would have helped to regulate the temperature so we would have been certain that light was the only limiting factor. Also the size of the pieces of pondweed were not all the same so some people may have achieved different results depending on the size of their pondweed and therefore how much surface area was available for photosynthesis to take place in the palisade mesophyll cells. The distance may not have been completely accurately measured and we could also have taken each set of results twice to make doubly sure we were getting an accurate picture.
I think that another way we could have gone about doing this experiment would have been to use a method where the amount of carbon dioxide being produced displaces some water held in a burette. The experiment could be set up as shown:
This would help to give us a greater idea of how much carbon dioxide is being produced and therefore how fast photosynthesis is occuring. As the burette fills with the gas water is displaced and the level drops. By measuring the level every 10 second we would easily be able to work out the rate of the reaction in the pondweed.
I think that overall our evidence is very reliable and that our results show what we thought they would. It could have been more accurate than it is but I think we achieved what we set out to do which was prove that as light intensity is increased photosynthesis speeds up.
Photosynthesis
Aim: To investigate a factor that affects the rate of photosynthesis.
Outline: A piece of pondweed will be cut and placed into a beaker containing water and sodium hydrogen carbonate. A lamp will be shined on to the pondweed and the amount of bubbles released from the plant will be counted. The lamp will be adjusted to different distances from the plant to try and obtain different results.
Photosynthesis Equation:
6CO2 + 6H2O light energy & chlorophyll C6H12O6 + 6O2
Variables:
Experimental Variable- Light intensity is to be the variable explored in this investigation. Increasing or decreasing the distance from the light source to the plant can vary light intensity.
Fixed Variables-
Light Wavelength (color)- Light energy is absorbed by pigments in the leaf such as chlorophyll. Chlorophyll easily absorbs blue light, in the 400-450 nm range, and also easily absorbs red light in the 650-700 nm range. Chlorophyll does not absorb green light or yellow light effectively but tends to reflect them, decreasing the amount of light absorbed and decreasing the rate of photosynthesis. Why the rate of photosynthesis increases or decreased from the amount of light energy absorbed is what is being investigated in this experiment. The light color can be fixed by using the same lamp throughout the experiment.
Carbon Dioxide- CO2 concentration can affect the rate of photosynthesis since the more CO2 in the air, the more CO2 that can diffuse into the leaf. This variable can be fixed by adding a fixed amount of sodium hydrogen carbonate to the beaker and plant. The experiment should also be completed in one session and under two hours so the plant does not use up a significant percentage of the CO2.
Water- Water is required in the photosynthetic reaction. When plants lack water, their stomata close to prevent further water loss. At the same time, closing the stomata cells doesn't allow CO2 to diffuse into the leaf. Water is also therefore, linked to the carbon dioxide factor. Water can be kept a constant by keeping the same amount of water in the beaker.
Temperature- Enzymes are used in photosynthesis and the respiration of the plant. Therefore, increasing the temperature will increase enzyme reaction and the photosynthetic rate until a certain point is reached when the enzymes denature. The temperature can be kept somewhat a constant by performing the experiment in one session, when the air temperature shouldn't change enough to affect water temperature. A transparent glass block will also be placed in front of the lamp to retain some of the heat from the lamp.
Plant- Different species plants have different photosynthetic rates due to the different leaf structures of the plants. Even plants of the same species may have slightly different rates of photosynthesis since there may be more or less chlorophyll in the leaves to absorb light. The size of the plant is also important since this would affect the amount of surface area for gas exchange. The only solution to controlling this variable is by using the same plant throughout the experiment.
Limiting Factors- Light, carbon dioxide, temperature, and chlorophyll are all limiting factors, meaning that even when there is surplus of every other variable, the rate of photosynthesis will be limited by the limiting factor until there is an optimal amount of the limiting factor to increase the rate of photosynthesis further. Otherwise, the rate of photosynthesis can no longer increase.
Prediction: I predict that increasing the light intensity will increase the rate of photosynthesis at a proportional rate where LI is inversely proportional to 1/d2 when LI= light intensity and d= distance (from light source to plant). This is true to a certain point until another factor is limiting the rate of photosynthesis.
Hypothesis: When chlorophyll absorbs light energy, the light energy cannot be immediately used for energy conversion. Instead the light energy is transferred to a special protein environment where energy conversion occurs. This happens by using the energy of a photon to transfer electrons from a chlorophyll pigment to the next. When enough light energy has been harnessed at a reaction center, ATP can be synthesized from ADP. During this reaction, oxygen is produced as a by-product and it is the oxygen bubbles that are being measured in the experiment. The greater the light intensity, the more light energy that can be transferred and harnessed to fuel reaction in photosynthesis.
Light intensity is inversely proportional to the distance squared because the light energy spreads out as it travels further and further from its source. Light energy travels along the circumference of an expanding circle. When light energy is released from a point, the energy is dispersed equally along the circumference. But since the circle is expanding, the circumference increases and the same light energy is distributed along a greater surface.
Method:
. Set up the apparatus as shown in the diagram above but leaving out the pond weed, funnel, test tube, water, and the sodium hydrogen carbonate.
2. Fill the beaker with 450 cm3 of water and 50 cm3 of NaHCO3.
3. Select 1 or 2 pieces of pond weed each roughly 5-10 cm long and cut off the stems.
4. Place the pond weed in the beaker and secure the funnel upside down over (on top of) the pond weed using the plasticine.
5. Place a water-filled test tube upside down and over the funnel (see diagram).
6. Place the ruler so that the "0" measurement is aligned with the side of the beaker. (distance measured from side of beaker to edge of light bulb)
7.) Place the lamp directly in front of the plant so that it is 0 cm away from the beaker. 8.) With the light shining on the plant, record the number of bubbles emitted in a 1 minute duration. Switch off the lamp and wait for another minute before taking another reading.
9.) Take 3 readings at the current distance and move the lamp 5 cm further away from the plant.
0.) Repeat steps 8 and 9 until 3 readings from at least 5 intervals of 5 cm have been taken.
1.) Proceed to the data analysis stage.
Results:
Distance (cm) Light Intensity (LUX) Bubbles per Minute Average bubbles/minute
2 3
0 (off scale) 240 249 251 246.7
5 11,000 201 222 214 212.3
0 5,800 183 185 188 185.3
5 3,570 154 152 158 154.7
20 2,320 128 118 124 123.3
25 1,780 93 88 90 90.3
30 1,320 67 65 70 67.3
35 1,050 53 50 48 50.3
40 850 38 38 37 37.7
45 690 26 25 24 25
50 580 17 17 18 17.3
The temperature of the water stayed a constant at about 29.5O C throughout the experiment.
Conclusion:
From the results that I have gathered I can state that an increase in light intensity certainly does increase the rate of photosynthesis. As was also expected in my prediction, the relationship between light intensity and the rate of photosynthesis was non-linear. From both graphs there is a best-fit curved line. This means that the rate of photosynthesis increases at an exponential rate.
However, my prediction that light intensity is inversely proportional to the distance squared did not fit into my results perfectly. The rule existed but there was often quite a large margin of error.
When measuring light intensity in terms of distance, the greater the distance, the slower the rate of photosynthesis. While the rate of photosynthesis was decreasing, the rate at which it was decreasing at was also decelerating. This is where the line in graph 1 shallowed.
When measuring the light intensity in terms of LUC, the greater the distance, the slower the greater the rate of photosynthesis. While the photosynthetic rate increased, the rate at which it increased was decreasing. This is where the line in graph 2 shallows.
The shallowing of the line in graph 1 can be explained by the fact that light intensity is inversely proportional to the distance squared. This means that as distance increases the light intensity decreases at an exponential rate. If light intensity decreases exponentially, photosynthetic rates that depend on light intensity also decreases exponentially. The line in graph 1 would eventually reach "0" where photosynthesis stops as light intensity limits this rate.
The shallowing of the line in graph 2 is due to other factors limiting the rate of photosynthesis. These other factors do not immediately limit the rate of photosynthesis but rather gradually. As light intensity increases the photosynthetic rate is being limited by certain factors such as carbon dioxide and temperature. As light intensity increases further, these factors limit the rate of photosynthesis even more until photosynthesis is completely limited and the graphed line become horizontal. This is when photosynthesis is being carried out at a constant rate.
The reason that a "f 1/b2 did not apply was due to the apparatus used. The lamp that I used had a cover that directed the light energy somewhat. The light energy did not spread out as much as a plain light bulb with no cover. The distribution of the light energy was more concentrated, changing the gradient of the graph.
Evaluation:
Overall, I would state the experiment as a success since my predictions were supported by my results. This is important in reflecting success only if my prediction was sensible and logical. Just as important is where the experiment was not a success and why. This photosynthesis investigation was probably not performed as accurately as it could have been due to some controllable and uncontrollable conditions. Some mistakes can be corrected.
While performing the experiment, the piece of pond weed did not photosynthesize at a steady rate, even when the distance from the plant to the light source was kept a constant. The second reading at 0 cm was far greater than the first reading at 0 cm. While the number of oxygen bubbles was being recorded, the rate at which the plant was photosynthesizing had increased several times. This may be due to the poor circulation of sodium hydrogen carbonate at the beginning of the experiment. Carbon dioxide may have initially limited the rate of photosynthesis. The readings at 0 cm and 5 cm were repeated many times until the rate of photosynthesis had begun to settle. From then on, there were no more similar problems during the experiment. To make sure that the there
The negative effects from this problem may be inaccurate data for some readings. These would show up on my graph. However, there seemed to be few anomalies than was expected when the experiment was being performed. Almost all readings were in correlation with each other and all of the anomalies were in the high photosynthetic rate end of the results. This was when the distance from plant to light source was 0 cm or only 5 cm.
A large factor in determining data accuracy is the amount of human error during experiments. The rate at which oxygen bubbles were being produced by my plant was so high that I found it difficult to count the amount of bubbles. I estimate a margin of error of at least 3 bubbles for each reading taken. To improve the accuracy of the results, the readings would have to be taken several more times. The entire experiment could have been performed again, and the new results could be combined if the same plant is used. But the photosynthetic rate of the same piece of pond weed would eventually decrease over time anyway. Repetitions would, however, improve the overall reliability of the results.
There are quite a few factors that could affect the results of my experiment. Some of these are variables that were mentioned earlier and could not be controlled, or they were variables that were not initially considered.
While performing the experiment, some of the oxygen produced from photosynthesis may have dissolved into the water. Some oxygen may have even been used by micro-organisms living on the pond weed. The amount of oxygen dissolved or used by microbes is probably insignificant to my results since the degree of accuracy at which I measured was not high enough. Some oxygen is also used during the respiration of the plant. But since only bubbles were counted, the volume of bubbles was not as important. But to volume of oxygen produced is important, since it was volume in terms of bubbles that were measured. As the rate of photosynthesis decreased due to a decrease in light intensity, the size of the bubbles produced also became smaller. This change in bubble size was no accounted for when the results were analyzed. For a more accurate analysis of the collected data, volume should have been measured instead of bubble quantity since the size of bubbles can vary. Using a capillary tube in place of the test tube so that the volume of each bubble could have been measured could have done this.
During the high intensities I had experienced counting difficulties of the bubbles being produced. There are also factors affecting accuracy at low light intensities. With low light intensity, the pond weed receives some light energy from background light such as sunlight seeping through curtains or the light from the lamp of another student's experiment. To eliminate most all background light, the experiment must be performed in a completely dark room. Even then, some of the light from the lamp in my experiment would reflect of the table and reach the plant though this amount of light is probably insignificant in affecting the rate of photosynthesis.
Temperature was also another factor that was controlled by the lamp being used. Even though a glass block was used in front of the lamp to prevent some heat from reaching the plant, not all the heat can be blocked. The extra heat, however, did not affect the temperature of the water, which stayed at between 290 and 300 C.
The method of the experiment could probably also be improved to obtain more reliable results. As already mentioned, the a capillary tube should be used in place of a test tube to accurately measure the volume of the oxygen produced. Due to the high rates of photosynthesis of the pond weed, readings should be taken within shorter time periods. I had originally chosen to count the number of bubbles in one minute but this produced miscounts in the readings. If during a repeated experiment, counting bubbles is still used, there is a smaller chance for human error when counting within a smaller time frame. If the capillary tube option was to be chosen, volume should be measured for a smaller time frame to reduce the overall time to complete the experiment. Also, during high rates of photosynthesis, it would still be difficult and impractical to measure the volume of oxygen produced for a long duration.
Due to the nature and convenience of the experiment, it could be easily modified to investigate another variable of photosynthesis. Since sodium hydrogen carbonate (NaHCO3) is used to provide the pondweed with carbon dioxide. Performing the experiment with different volumes of NaHCO3 could vary the amount of CO2. The plant would be kept at a constant distance from the lamp and a constant volume of water would be added to the sodium hydrogen carbonate. Another experiment using almost identical apparatus would be to vary the color of the light the plant absorbs. Using translucent color filters in front the lamps could vary this. Since light wave length has already been identified as a variable of photosynthesis, it would be interesting to actually test it. The only problem of this experiment is that there is no way to define or "measure" the color of light. Wave length would be a solution but this cannot be measured with available equipment. We only have a general idea of how to class colors. Because of this, the colored light experiment should not be taken as seriously as light intensity or carbon dioxide.