P P
S2 S3
S’2
A2 A3 S’3
B2
D2 B3
C2 C3
D3
Q Q
O E2 F2 O E3 F3
FIGURE 2 FIGURE 3
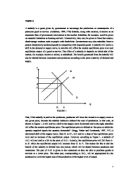
Moreover, by observing Figure2 and Figure 3, we can also work out how the benefit of the subsidy, represented by AB, is divided between the producers and the consumers. It is basically determined by the price elasticity of the demand and supply curve. Price elasticity of demand means ‘the responsiveness of the quantity demanded of a good to a change in the price of a good or service.’(Parkin, Powell and Matthews, 2000, G13) Figure 2 shows that, in the market where demand is more elastic than the supply, consumers only acquire a small proportion of benefit, corresponding to A2B2, compared with the benefit that acquired by the producers, corresponding to B2C2. Conversely, according to Figure 3, in the market where supply is more elastic than demand, consumer will enjoy a large percentage of the subsidy, represented by A3B3, while producers only share the benefit of B3C3. The reason for this is that the subsidy benefits most greatly to the side of the market that is less sensitive to price. In the market where supply is more elastic than demand, the increase percentage of supply will be larger than the increase percentage of the demand. Therefore the competition between producers will drive the price lower. An example could be the salt industry. Salt, as an essential good, actually has no close substitution. It causes the demand of the salt to be very inelastic. Therefore, if government subsidises the production of salt, most of the subsidy will be passed to consumers. By the same theory, if demand is more elastic than supply, there will be a stronger competition among consumers which will raise the price and leave a larger percentage of subsidy to the producers.
S
S’
B (A) D FIGURE 4
C
O
In addition, if the government subsidise particular companies rather than the whole market, as in Figure 4, the part of benefit, AB, which used to belong to consumers will disappear. All the benefit of the subsidy will be received by the producers, because, in this case, the price elasticity of demand is perfect elastic, which means that there will be an unlimited quantity of demand at that price level.
On the other hand, if the subsidy is paid to the consumer, the theory is similar, but the consequence will be totally different.
P
S5
A5
B5
D’ 5
C5
D5
Q
O E5 F5
FIGURE 5
A subsidy to consumers will enable them to pay a higher price for the same goods or service, because it indirectly reduced the price. The demand curve, therefore, will shift upwards and to the right, which means that there will be more demand at any given price. As Figure 5 shows, the equilibrium price will rise from C5 to B5 while the equilibrium output will increase from E5 to F5. However, it is important to notice that the amount that the equilibrium price has gone up by is less than the amount of the subsidy. The reason is that a part of the subsidy, A5B5, would have to be allocated to consumers in order to make up the less utility they would get from their extra purchases. The other part of the benefit, represented by B5C5, will be received by the producers as the price has gone up.
P P
S6
A6 A7
B6
D’6 S7
B7
C6 C7
D’7
D6 D7
Q Q
O E6 F6 O E7 F7
FIGURE 6 FIGURE 7
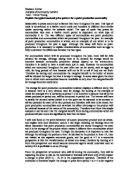
Similarly with the first case, the share of subsidy between buyers and sellers are also determined by the elasticity of the demand and supply curve. If the supply curve is less elastic than the demand curve, as in Figure 6, the percentage change of supply will not be as large as the percentage change of demand as an effect of the subsidy. Consumers have few alternative to switch to, thus most of the benefit, BC, will be appropriated by producers. In contrast, in those markets where supply is more elastic than demand, for example, in Figure 7, producers have few consumers to turn to. Like in the tobacco market, non-smoker will not start to smoke simply because the cigarettes are cheaper than before. Therefore, most of the subsidy, BC, will certainly be received by consumers.
In addition, if the subsidy is paid to a certain group rather than all the consumers in the market, as in Figure 8, the supply curve will be regarded as perfect elastic, in other words, at this price level there will be unlimited supply available. In this case, all the producer benefit, BC, will be transferred into consumer benefit.
P
A
B (C) S FIGURE 8
D’
D
Q
O E F
To sum up, subsidy, as an important way of government intervention, affects the market by leading to a shift in the supply or demand curve, and therefore lead to a change of the market equilibrium price level and equilibrium output. However, the direction of change, in terms of equilibrium point will be different depends on which side of the market the subsidy is paid to. When the subsidy is paid to the producers, the supply curve will shift downwards and to the right, which will drive the equilibrium price to fall and drive the equilibrium output to increase. If consumer is the side that is subsidised, the demand curve will shift upwards and to the right, and both of the equilibrium price and equilibrium output will rise. The share of subsidy between producers and consumers, regardless of which side was subsidised, basically depends on the elasticity of the demand and supply curve. The side that responses slower to a change of price (less elastic to the price) will receive most of the benefit. Compared with the inelastic side, the elastic side has fewer alternative to switch to therefore has less market power and will have to give up most of the benefit of the subsidy.
BIBLIOGRAPHY:
Anderton, A., Economics (2nd ed.), 1999, Oxford: by Causeway Press. (ISBN 1-873929 4)
Begg, D., Fisher, S. And Dornbusch, R., Economics (5th ed.), 1997, Maidenhead: by McGraw-Hill Book Company, (ISBN 0 07 709412-3)
Parkin, M., Powell, M. and Matthews, K., Economics (4th ed.), 2000, Essex: by Addison-Wesley, (ISBN 0201-59608
ECONOMICS ESSAY 1
NAME: SILU GUAN
DEPARTMENT: ISMA
TUTOR: RAJI RAJAN