Variable + Fixed Cost= Total Cost
£10,000.00 + £18,000.00= £28,000.00
To find Break Even Point:
Selling Price- Materials= Break Even Point
£15 – £7= £8
Total Fixed Cost
Selling Price - Materials
The three objectives I am going to choose that the company have, and use to see how break even helps to achieve the objectives are:
1) To make profit by selling goods to customers.
2) The purpose of the business is to sell a number of production units, to increase sales and profits.
3) To offer customers the best value for money at the most competitive prices.
- What information does the break even provide the firm with in order for them to meet their aims/objectives e.g. costs, revenue, profit etc?
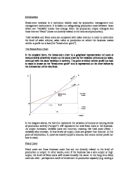
The break even point on the graph indicates that it is the point at which the gains equal the losses. There is no profit of loss made at the break even point. The break even point is made when the cost and revenue are equal.
The break even on my graph shows that no profit or loss will be made at 9 productions of units. The break even graph also tells the company whether have made their profits and losses, using the figures.
The break even graph meets the first objective, by showing when the profit will be made, by selling an amount of production units. This amount is 9. If the company sell nine or more production units, then the profit will be made, because this is the break even point on the graph. Anything lower than that will cause losses.
The second objective is met by looking at the break even point on the graph. From the break even point you can tell that the company need to sell over nine production units to achieve their profits, and increase their sales. By selling over nine production units they will achieve this objective, because you can see that the total cost and revenue will be rising, each time the number of unit is increased.
The third objective is met by the company deciding a reasonable price range for the products to be sold at. From the graph you can tell that if the fixed selling price of one product is £15, then you can see how much profit and revenue and total cost will be made each time a production of units is sold. The more the production of units the higher the number of revenue and total costs.
All my calculations were worked out by using the formulas above.
- How and why might this information be useful?
This information, on the break even graph is useful for the Tesco Company, because they can see if they have met their aims and objectives, and if they have made enough profit and what losses they have made, by selling a product. They use this graph to make targets and compare it with other products and companies. The graph is also useful, because they can compare it with other productions and see which products make the most and least profits. They can also work out if they sell products at higher or lower prices then how much more or less profit, revenue and total cost should be made. The company use the graph to find out how many production units need to be sold before they can start making their profit.
They keep the graphs and use them in the future to improve the new productions they sell.
- Does the use of the model allow the firm to meet its objectives? If so how/why? If not why not?
The Tesco company objectives are:
1) To make profit by selling goods to customers.
2) The purpose of the business is to sell a number of production units, to increase sales and profits.
3) To offer customers the best value for money at the most competitive prices.
The model allows the firm to meet its objectives, because the graph can indicate the where the profits will increase and where the losses are made. The graph shows how many units of production, they have to sell before they start making the profits, and if they do, the company meets their aims and objectives. The break even graph is very important to the company, because this way they work out by using the formulas and the given prices, to see whether the company will increase their sales and profits.