Ratio analysis is a technique commonly used to make better sense of financial data
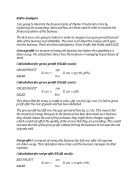
Ratio analysis is a technique commonly used to make better sense of financial data and help inform makingfinancial decisions. It is not any use of making the decisions on its own it just alerts the managers to any areas that maybe of concern. Ration analysis does not look at sales revenue or profit in isolation, ratios put these figures into the context by comparing them with similar data. So instead of looking at the total profit generated by the business over a year, ratio analysis might compare this figure to the amount of capital that is available to the business. Ratio analysis can reveal which business is best at generating profit. FormulaFormula With FiguresExplanation Gross Profit MarginGross Profit--------------- x 100 = %Sales 256200----------------- x 100 = 57.7%444000This ratio shows how well a business is trading. Gross profit has to meet expenses and costs to provide a reasonable net profit; this is also used in comparisons. This is considered to be good position for SIGNature to be in.Net Profit MarginNet Profit-------------- x 100 = %Sales 66660----------------- x 100 = 15%444000This show the net profit as a percentage which is essential for a business because a business needs to know if it is able to meet its expenses and the