Opportunity cost is defined generally as the value of the next best opportunity. In the context of national production, the nation has opportunities to produce wine and cheese for example. If the nation wishes to produce more cheese, then because labour resources are scarce and fully employed, it is necessary to move labour out of wine production, in order to increase cheese production. The loss in wine production necessary to produce more cheese represents the opportunity cost to the economy.
A country has a comparative advantage in the production of a good if it can produce that good at a lower opportunity cost relative to another country.
Another way to describe comparative advantage is to look at the relative productivity advantages of a country. In the U.S., the labour productivity in cheese is 1/10 while in France it is 1/20. This means that the U.S. productivity advantage in cheese is (1/10)/(1/20) = 2/1. This means the U.S. is twice as productive as France in cheese production. In wine production, the U.S. advantage is (1/2)/(1/5) = (2.5)/1. This means the U.S. is two and one-half times as productive as France in wine production.
The comparative advantage good in the U.S. then is that good in which the U.S. enjoys the greatest productivity advantage, wine. France’s comparative advantage good however, is that good in which it has the least productivity disadvantage in production, namely cheese.
The only case in which neither country has a comparative advantage is when the opportunity costs are equal in both countries. It would seem however, that this is an unlikely occurrence.
The simplest way to demonstrate that countries can gain from trade in the Ricardian model is by use of a numerical example. This is how Ricardo presented his argument originally. The example demonstrates that both countries will gain from trade if they specialise in their comparative advantage good and trade some of it for the other good. I have set up the example so that one country (the U.S.) has an absolute advantage in the production of both goods. Ricardo’s surprising result was that a country can gain from trade even if it is technologically inferior in producing every good. Adam Smith had explained in the Wealth of Nations that trade is advantageous to both countries, but in his example, each country had an absolute advantage in one of the goods. That trade could be advantageous if each country specialises in the good in which it has the technological edge, is not surprising at all.
To see the effects of specialisation and free trade, we must compare it to a situation of no trade, or autarky. Thus, we must construct an autarky equilibrium first. To determine the autarky production point requires some information about the consumer demand for the goods. Producers will produce whatever consumers demand at the prevailing prices such that supply of each good equals demand. In autarky this means that the production and consumption point for a country are the same.
For the purpose of this example I will simply make-up a plausible production/consumption point under autarky. Essentially, I have assumed that consumer demands are such, as to generate the chosen production point. The Table below shows the autarky production/consumption levels for the two countries. It also shows total world production for each of the goods.
Autarky Production/Consumption Points
In the above diagram, I have depicted the autarky production and consumption points for the U.S. and France. Each point lies on the interior section of the country’s production possibility frontier.
Ricardo argued that trade gains could arise if countries first specialise in their comparative advantage good and then trade with the other country. Specialisation in the example means that the U.S. produces only cheese and no wine, while France produces only wine and no cheese. These quantities are shown in the following Table. Also shown are the world totals for each of the goods.
At this point, we can already see a remarkable result. When countries specialise in their comparative advantage good, world output of both wine and cheese rises. Cheese output rises from 19 to 24 pounds. Wine output rises from 6 to 8 gallons. What is more, the output increases occur without an increase in the quantity of labour used to produce them. In autarky, it took 48 worker-hours to produce 19 pounds of cheese and 6 gallons of wine. With specialisation, the same 48 worker-hours produce 24 cheese and 8 wine. This means that there is an increase in world productivity – more output per unit of labour. Often times, this productivity improvement is referred to as an increase or improvement in world production efficiency.
The increase in world production efficiency does not benefit the countries unless they can trade with each other after specialisation. Both production points were feasible under autarky but the countries demanded some of each good. Thus, the countries will want some of each good after specialisation and the only way to accomplish this is through trade. Now, if the world can produce more of both goods through specialisation, clearly there must be a way to divide the surplus between the two countries, so that each country ends up with more of both goods after trade than they had in autarky.
The surplus in world production amounts to 5 extra pounds of cheese and 2 extra gallons of wine. To assure that trade is advantageous for the two countries, each must have at least as much to consume of one good and more to consume of the other. Suppose we split the wine surplus equally and give 3 extra pounds of cheese to France and 2 extra pounds to the U.S. Since the U.S. consumed 16 cheese and 4 wine in autarky, they would now have 18 cheese and 5 wine after specialisation and trade. France, which began with 3 cheese and 2 wine in autarky, would now have 6 cheese and 3 wine. Consumption and production after trade for the two countries is shown in the Table.
In order for consumption of both goods to be higher in both countries, trade must occur. In the example, the U.S. is consuming 5 gallons of wine and producing none, so it must import the 5 gallons from France. France is consuming 6 pounds of cheese with no cheese production, so it must import the 6 pounds from the U.S. The terms of trade is ToT = 5 gal/6 lbs or 5/6 gal/lb.
In conclusion, the Ricardian model numerical example assumes that countries differ in their production technologies such that one of the countries is absolutely more productive than the other in the production of each of the two goods. If these two countries specialise in their comparative advantage good, then world production rises for both goods. Increased output occurs even though there is no increase in the amount of labour input in the world, thus, the example demonstrates that specialisation can raise world production efficiency. Because of the increase in output, it is possible to construct a terms of trade between the countries such that each country consumes more of each good with specialisation and trade than was possible under autarky. Thus, both countries can gain from trade. The surprising result from this example is that a country, which is technologically inferior to another in the production of all goods, can nevertheless benefit from trade with that country.
A numerical example can display only one possible outcome for the model. As such, all conclusions should be viewed as possibilities rather than a general result of the model. With further thought there are some problems with the example. First, it is conceivable that with a different choice for the country’s autarky production/consumption points, world output might not rise for both goods upon specialisation. In this case, we could not be sure that both countries would gain from trade. Second, since we merely made-up a terms of trade that generated the interesting conclusion, we could ask whether a favourable terms of trade is likely to arise or not. Is it possible to make-up a different terms of trade such that one country enjoys all the benefits of increased production while the other is made worse-off? How can we be sure that this outcome would not arise? Finally, even if the country has more of both goods after trade, can we be sure that all consumers would have more of both goods? Perhaps, some consumers would have more while others less.
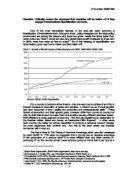
In the second half of the 20th century, international trade experienced a notable growth, especially after the 1970s. The outcome has been a shift in with many developing countries having a growing participation to international trade. This trend obviously reflects the emergence of a more complex and interdependent global economy. The volume of exchanged goods and services between nations is taking significant part in the generation of wealth. By 2003, international trade was accounting , a twofold increase since 1950. Three main factors can be linked to this process.
Production systems are more flexible and embedded, which encourages exchanges of commodities and services. Foreign direct investments are commonly linked with the globalisation of production as corporations invest abroad in search of lower production costs and new markets. is a leading example of such a process. There is a growing availability of goods and services that can be traded on the global market.
Transport costs have decreased significantly facing innovation processes and a growth of the efficiency of modes and infrastructures. As a result, the transferability of commodities has improved.
Integration processes such as the emergence of economic blocks and the decrease of tariffs at a global scale, promoted trade. The higher the level of economic integration, the more likely the concerned elements are to trade. The transactional capacity is consequently facilitated with the that follows increased integration.
International trade, both in terms of value and tonnage, has been in the global economy. While developed countries still accounted for three quarters of the global trade in 2000, developing countries have seen their share climb to one third. The dominant factor behind this growth has been an increasing share of manufacturing activities taking place in developing countries, as manufacturers are seeking low cost locations for many stages of the production chain. The evolution of . There are however significant fluctuations in international trade that are linked with economic cycles of growth and recession, fluctuations in the price of raw materials, as well as disruptive geopolitical events. The international division of production has been accompanied by growing flows of manufactured goods, which take a . There is relatively less bulk liquids (such as oil) and more dry bulk and general cargo being traded.
The geography of international trade reveals a dominance of a small number of countries, mainly in . Alone, the account for about a third of all global trade. Further, G7 countries account for half the global trade. A growing share is being accounted by the developing countries of Asia, with China accounting for the most significant growth both in absolute and comparative terms. Those geographical and economic changes are also reflected over Trans-Oceanic trade with .
Regionalisation has been one of the dominant paradigms of global trade. The bulk of international trade has a regional connotation, promoted by proximity and , such as NAFTA and the European Union. The growth of the amount of freight being traded, as well as a great variety of origins and destinations, promotes the importance of international transportation as a fundamental element supporting the global economy.
Therefore, on whether the theory of comparative advantage explains the pattern of world trade today, we can safely say that the answer is “no”, as the world is characterised by what is called intra-industry trade (i.e., trade in differentiated products). For example, Germany exports cars such as BMW, Mercedes-Benz and Volkswagen but it also imports cars such as Toyota, Honda, Fiat, Ford, etc.. This means that some of the Ricardian assumptions such as perfect competition and constant returns to scale, may not hold due to market imperfections, transport costs, diminishing returns to scale in production, etc..
Personally, I believe that both absolute and comparative theories are very useful but very rarely fit with today’s trade patterns because there are trade barriers, such as NAFTA and the European Union. However, there are areas of trade where both theories are accurate, but only if two countries and two commodities are focused, and exclude large multi-national corporations.
BIBLIOGRAPHY
TEXTBOOKS
-
Daniels, J.D., Radebaugh, L.H., Sullivan, D.P., (2004), International Business Environments and Operations, (Tenth Edition), New Jersey: Pearson Prentice Hall.
-
Smith, A., (1998), An Inquiry into the Nature and Causes of the Wealth of Nations, Washington: Regnery Publishing.
-
Ricardo, D., (1996), On the Principles of Political Economy and Taxation, Amherst, New York: Prometheus Books.
-
Linder, S.B., (1961), An Essay on Trade Transformation, New York: Wiley.
-
Campbell, D., Houston, B. and Stonehouse, G., (2002), Business Strategy: An Introduction, (Second Edition), Oxford: Butterworth-Heinemann.
-
Fry, F.L., Stoner, C.R. and Hattwick, R.E., (2003), Business: An Integrated Approach, (Third Edition), New York: McGraw-Hill Company.
-
Hall, D., Jones, R., Raffo, C. and Chambers, I., (1997), Business Studies, (First Impression), Lancashire: Causeway Press Ltd.
JOURNALS
-
Jeffrey A. Frankel and David Romer, “Does Trade Cause Growth?,” The American Economic Review 89, no. 3 (June 1999): 379-99.
-
Paul Krugman, “Scale Economies, Product Differentiation, and the Patterns of Trade,” The American Economic Review 70 (December 1980): 950-59.
-
Donald R. Davis and David E. Weinstein, “An Account of Global Factor Trade,” The American Economic Review 91, no.5 (December 2001): 1423-53.
-
“World Trade Slows Sharply in 2001 Amid the Uncertain International Situation,” WTO News: 2001 Press Releases (October 19, 2001): 1-7.
-
Don P. Clark, “Determinants of Intraindustry Trade Between the United States and Industrial Nations,” The International Trade Journal XII, no. 3 (Fall 1998): 345-62.
-
Kyle Bagwell and Robert Staiger, “National Sovereignty in the World Trading System,” Harvard International Review 22, no. 4 (Winter 2001): 54-59.
WEB DOCUMENTS
-
World Trade Organization, (Online), (2005), United Kingdom:
http://www.wto.org/english/res_e/statis_e/its2004_e/its2004_e.pdf, (Accessed: 12th February, 2005, 15:39pm).
-
International Trade, (Online), (2005), United Kingdom:
www.lancs.ac.uk/people/ecamas/iblec7%202004.doc, (Accessed: 15th February, 2005, 16:21pm).
-
, (Online), (2005), United Kingdom:
www.columbia.edu/~drd28/IADB_Article.pdf, (Accessed: 19th February, 2005, 14:23pm).
-
agricultural trade patterns, (Online), (2005), United Kingdom:
www.wto.org/english/news_e/pres04_e/pr378_e.htm, (Accessed: 24th February, 2005, 12:26pm).
5. , (Online), (2005), United Kingdom:
, (Accessed: 27th February, 2005, 13:17pm).
6. , (Online), (2005), United Kingdom:
ucatlas.ucsc.edu/trade/trade_theme.php, (Accessed: 4th March, 2005, 15:46pm).
7. , (Online), (2005), United Kingdom: www.cepii.fr/anglaisgraph/ workpap/summaries/1997/wp97-07.htm, (Accessed: 8th March, 2005, 16:37pm).
8. International Trade Patterns, (Online), (2005), United Kingdom: gemini.econ.umd.edu/cgi-bin/conference/ download.cgi?db_name=mwie2005&paper_id=98, (Accessed: 10th March, 2005, 11:54am).
9. , (Online), (2005), United Kingdom:
www.e.u-tokyo.ac.jp/cirje/ research/dp/2004/2004cf293.pdf, (Accessed: 12th March, 2005, 17:18pm).
10. , (Online), (2005), United Kingdom: www.nuff.ox.ac.uk/economics/papers/1998/w11/evnuffa.pdf, (Accessed: 14th March, 2005, 15:49pm).