
GDP Data – Problems Over Time
Tarek Elsayed February 10, 2002 GDP Data - Problems Over Time Comparing GDP/national income of the UK today with the national income in the pasts presents many problems. These are: Prices - Prices have tended to increase over time. So an increase in national income over the period does not necessarily indicate that there has been an increase in the number of goods and services produced in the economy. Only if the rate of increase of national income measured in money terms (the nominal rate of economic growth) has been greater than the increase in prices (the inflation rate) can there be said to have been an increase in output. So when comparing over time, it is essential to consider real and not nominal changes in income. The accuracy and presentation of statistics - National income statistics are inaccurate and therefore it is impossible to give a precise figure for the change in income over time. Moreover, the change in real income over time will also be affected by the inflation rate. The inevitable errors made in the calculation of the inflation rate compound the problems of inaccuracy. The method of calculation national income and the rate of inflation can also change over time. It is important to attempt to eliminate the effect of changes in definitions. Changes in population - National income statistics are often used to compare living standards over

How have the Rates of Inflation in the UK Changed Since the Monetary Policy Committee was Established in 1997?
How have the Rates of Inflation in the UK Changed Since the Monetary Policy Committee was Established in 1997? Contents * Introduction Page 3 * Background Page 3 * Theory Page 3 - 8 * Date Presentation, Analysis and Evaluation Page 9 - 18 * Conclusion Page 19 * Bibliography Page 20 Contents for diagrams and graphs: * Diagram 1 Page 4 * Diagram 2 Page 4 * Diagram 3 Page 5 * Diagram 4 Page 6 * Diagram 5 Page 7 * Diagram 6 Page 7 * Diagram 7 Page 8 * Graph 1 - RPIX Inflation Page 9 * Graph 2 - RPI Inflation Page 10 * Graph 3 - British and European Union Inflation Page 11 * Graph 4 - Base Rates of Inflation in the UK since 1990 Page 11 * Graph 5 - The Economic Cycle since 1988 Page 13 * Graph 6 - Growth of Real National output and RPIX Inflation Page 13 * Graph 7 - UK Consumer Confidence Page 14 * Graph 8 - Mortgage Interest Rates and Consumption Page 15 * Graph 9 - Real Personal Disposable Income Page 15 * Graph 10 - UK Interest Rates and RPIX Inflation Page 16 How have the Rates of Inflation in the UK Changed Since the Monetary Policy Committee was Established in 1997 Introduction In this project I will be looking at how the inflation rates have changed in the UK since 1991. Specifically I will be looking at whether the independence of the Bank
Explain how supply side measures can be used to promote economic growth (15)
Explain how supply side measures can be used to promote economic growth (15) Supply side policies are government policies designed to increase the productive potential of the economy and push the LRAS curve to the right. They can affect the economy in a number of ways: increasing the supply of the quantity and quality of labour, raise the amount of capital employed, further the exploitation of natural resources and increase efficiency of the factors of production. 'Fixing infrastructure' was one of the factors David Cameron has mentioned that would provide immediate economic boosts and help with growth in the long term as well. To promote economic growth, supply side policies focus on shifting the LRAS curve to the right. Supply side policies are an economic theory that states that a reduction in taxes will stimulate the economy through increased consumer spending. Over time, the increased economic growth will generate a larger tax base, which will recoup the revenue lost from the tax cut. Some argue that cutting taxes on activities such as saving and working would increase the productive potential of the economy. The level of taxes has an impact on investment and therefore LRAS. An increase in taxes on businesses will reduce the profitability of investment. With a lower rate of return, fewer investment projects will be carried out, limiting the productive potential and
Report on Austrlian Workplace Relations
Contents Introduction Key Characteristics Impact on the Economy Recent Changes Conclusion Bibliography Appendix A Newspaper article Appendix B Magazine/Journal Article Appendix C Australian Government Website Material Appendix D Non-government Website Material Appendix E Book Excerpt Introduction Workplace relations play a very crucial role within the Economy of Australia. The IR or industrial relations system various laws and procedures have been established to organise workplace relations. Industrial relations concentrate on determining the process of setting wage levels and resolving conflicts within the labour market. This report will effectively display key characteristics, impacts and contemporary changes of Workplace Relations. Key Characteristics An important part of Workplace Relations is Wage setting. Industrial relations allow three ways to set the wage level of employees. Firstly the collective enterprise agreement Is a very consistent form of wage setting. These agreements are negotiated between employers and the employees. Secondly there are AWAs or awards which state the minimal standards that must be follow by employers. Lastly there are also individual contracts which are discussed and negotiated by the employer and the employee. These are classified as Common-law Contracts under the Workplace Agreements. The effectiveness and success of
Protectionism Can Solve the Problems of Countries Tempted to use such Policies
Protectionist methods can be used by countries to solve their own economic problems in certain industries. Countries that are tempted to use such policies are likely to be having problems with exporting goods and services or problems with inefficiency in some industries. These sorts of methods are used to eliminate competition from foreign companies trying to sell their goods in that country. Tariffs and quotas are the most common form of a trade barrier and these barriers reduce the amount of trade between countries. Protectionism eliminates competition. If a country manufactures and transports certain goods at a very high rate and another at a very low rate, consumers in the first country are obviously going to buy goods imported from the other country as these goods are cheaper. There will be a high demand for the imported goods because people always want the cheaper goods. There will be little or no demand for home-made products because it is too expensive. This will lead to the home companies going bust because it would not sell any of its products. The reasons for the extensive costs may be due to that country's tax system or expensive related goods needed as well too manufacture those goods. Whatever the case, the company going bust leads to many job losses and unemployment. This has a knock-on effect to other local businesses. This is because the unemployed would

Explain the possible impact of a world-wide recession on the components of the circular flow of income for a small and open economy such as Singapore.
Song Teck 023A 4a.) Explain the possible impact of a world-wide recession on the components of the circular flow of income for a small and open economy such as Singapore. [10m] The circular flow of income for an open economy is a model that shows the flows of goods and services and factors of productions between firms and household and in the process injections and withdrawals are made by the government and the rest of the world. This model shows that household provides the factors of production for firms who produce goods and services. In return the factors of production receive the factor payments (such as wages, dividend, and profits) which are in turn spent on the firm's output. The circular flow of income can be expanded by injections (addition to the circular flow which does not come from the domestic expenditure of the household in the form of investment, government expenditure, export revenue) and reduced by withdrawals (any part of income not passed on within circular flow of income in the form of savings, taxes, imports). Being a small and open economy, Singapore have place a strong emphasis on export orientated growth due to our small domestic market, thus resulting in a strong dependence on export revenue to sustain our economic growth. Moreover, with limited domestic investment and the openness to international capital flow, we are more dependent on foreign
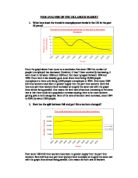
YR10 ANALYSIS OF THE UK LABOUR MARKET
YR10 ANALYSIS OF THE UK LABOUR MARKET . What have been the trends in unemployment levels in the UK in the past 25 years? From the graph above I can come to a conclusion that since 1984 the number of people unemployed has decreased. However, it hasn't been constantly decreasing, it went down in between 1986 and 1990 and then back up again between 1990 and 1993. From here it has steadily gone down from there being 10,000 people unemployed to there only being 3,000 people unemployed in 2004. Ever since 1984 full time workers have been in greater supply then the part time workers. Both full time and part time workers have increased at roughly the same rate with the graph lines almost being parallel. One reason for both sets of workers increasing at the same rate is that there could be a population increase causing there to be more workers getting jobs in both categories. Both of the sets of workers have increased, since 1984 to 2004, by about 2500 people. 2. How has the split between full and part time workers changed? Ever since 1984 full time workers have been in greater supply then the part time workers. Both full time and part time workers have increased at roughly the same rate with the graph lines almost being parallel. One reason for both sets of workers increasing at the same rate is that there could be a population increase causing there to be more workers getting
Explain the main determinants of the level of consumption expenditure in an economy.
Explain the main determinants of the level of consumption expenditure in an economy. Consumption expenditure (C) is one of four elements, which denotes the total spending on goods and services produced in an economy. This is known as Aggregate Demand. The other three elements of Aggregate Demand are Investment expenditure (I), Government spending (G) and the Net expenditure on exports and imports (X-M). The equation for AD can be written as: - AD = C + I + G + (X-M). The main determinants of Consumption expenditure are: - * Changes in disposable income: This is a key determinant of consumption expenditure. It is common sense to see that, if a persons income increases so does the total spending on goods and services by that person. This would lead to a shift to the right in the AD curve. * Interest rate changes: Higher interest rates lead to a decrease in spending by consumers. People will be able to save more and will be able to pay back more money to mortgage repayments. This would lead to a shift to the right in the AD curve. * Changes in unemployment levels: If unemployment levels fall, consumers are less afraid that they will lose their jobs, and therefore feel more confident to borrow money and purchase consumer durables. This would lead to an increase in consumer spending, hence an increase in AD, shifting the curve to the right. * Price expectations: If

'The trade deficit on goods in the first three months of the year was £7.1bn.' Explain the meaning of this statement.
Bernice Berschader 'The trade deficit on goods in the first three months of the year was £7.1bn.' (a) Explain the meaning of this statement. The above statements states that between January and March 1999 the UK lost £7.1 billion on trade, as a result of a trade deficit or current account deficit on the Balance of Payments. A Current Account deficit is where imports into a country exceed exports. This leads to a disequilibrium of injections and withdrawals. Withdrawals from the circular flow of income exceed injections into the circular flow of income. Though the current account consists of 4 elements, visible goods, invisible services, net income and investment income, the statement above discusses the deficit of an element of the current account, the visible goods element Even though a current account deficit results in the value of imported goods exceeds the value of exported goods, the demands for exports and imports will not be affected in the short run due to the Martial Lerner Conditions. Though eventually this will result in the foreign currency price of UK exports to decline, it will take some time for countries to react to these changes. In the short run the volume of exports will remain the same before it increases as a result of devaluation in the long run. This is illustrated by the J-Curve effect below. (b) Examine the possible causes of
It is impossible for unemployment ever to be zero
Dessislava Dimitrova International Studies Student# 0402371 It is impossible for unemployment ever to be zero. Why? The following essay examines unemployment, the reasons for which it exists and the causes, which do not allow it ever to be zero. As a start there needs to be set a definition of unemployment as a phenomenon. Unemployment is usually expressed as a number or as a percentage of a larger number. Although it has been ambiguous who has to be included in the percentage, there are members of society without a job, for whom it is certain that should not be added. Such people are children, pensioners, sick, institutionalized, as well as people, who are not currently looking for a job, such as parents choosing to stay at home to raise a family. Taking under consideration the above mentioned circumstances, the economists' definition for the unemployed can be expressed as the following: "Those of working age who are without work, but who are available for work at current wage rates."1 Individuals who are at a working age but are not willing to work are considered to be unemployed as well. Since the number of unemployed is expressed as a percentage, it is a fraction of the total labour force (which is defined as "The number employed plus the number unemployed"2). This percentage can be worked out by using the subsequent formula. Unemployment rate = (Number unemployed


