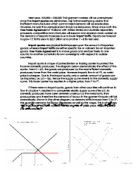
Import quota is a type of protectionism or trading barrier to protect the income domestic producers. The diagram below demonstrates the effect of the quota. From 0 – qD, the goods are produced by the most efficient domestic producers, lower than the world price. However imports flow in at P2, as world price is cheaper. Due to the import quota, only a certain amount of goods can be imported, i.e. qD – Qq. Hence the supply curve reverts to the domestic supply curve. This trade barrier has resulted in a higher price, from P to P*.
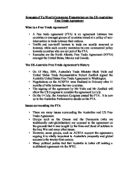
If there were no import quota, goods from other countries will continue to flow in at price P, resulted in a completely elastic supply curve after qD. As domestic producers have been severely undercut by the merchants, they produce less and therefore the demand of labour in the garment industry will fall dramatically. Shown in the other diagram, as demand shifts inwards from D to D*, the quantity demand for labour decreases as well as the wage. This is why many ‘Thai garment industry workers risk losing their jobs once import quotas are eliminated.’
‘But the jobless problems could be short lived of the United States and Thailand proceed in hammering out a free trade agreement that will likely lower tariffs on Thai garment exports.’ and ‘the Thai Australia free trade agreement, … , would increase the Kingdom’s garment export.’ The diagrams below illustrate the effect of a free trade agreement. Since Thailand is exporting to United States and Australia in a lower tariff rate, the supply curve of garment shifts vertically down from S* to S**. The price is lower and the demand for garment in United States and Australia has rose from Q to Q*. Hence, as Thai garment industry is exporting more to United States and Australia because of the free trade agreement. According to the national income accounting,
AD (Aggregate Demand) = C (Consumption) + I (Investment) + G (Government Expenditure) + (X (Export) – M (Import))
As X increases, AD increases as a result. The aggregate demand linked closely with the labour market. Demand for labour increases when aggregate demand increases. In the other diagram, it indicates that the demand for labour has risen, shifted from D* to D**. Therefore quantity of labour increases, Q* to Q**; as well as the wages, P* to P**.
On the other hand, the author seemed ignored the impact of the elimination of import quota and the free trade agreement on other sectors of Thailand’s and United State’s garment markets. The elimination of import quota is certainly affecting the employment of garment workers; however it also benefits the consumers as well, shown in the two diagrams on the next page. The blue area is the gain in consumer surplus. Moreover, the government of United States and Australia is also affected by the free trade agreement; the green area indicates a loss in government revenue since lower tariffs on the import goods from Thailand.
Another thing the author forgot to mention is whether the trading bloc leads to an increase in total world trade or not. This depends on the amount of trade diversion contrast to trade creation.
Change in world trade = Trade created within the bloc – trade reduction with non- member countries
Usually for free trade agreements, the trade barrier is low and there are few restrictions. Trade creation should be more than trade diversion, results in increasing world trade.
To conclude, there are more economic strategies to protect the domestic producer such as imposing higher import tariffs, provide subsidies for firms, setting up administrative barriers and entering custom union or common market.