The Natural rate of Unemployment:
The Natural Rate of Unemployment (NRU) is the rate of unemployment where the labor market is in equilibrium. At a given wage rate the supply of labor will equal the demand.
The NRU is also often referred to as the level of full employment. However, this does not mean zero unemployment in the economy. There will always be some level of unemployment present in the economy, either frictional or structural. The NRU is currently estimated to be around 6%2. It varies from one country to the next and changes over time. It is effected by the technological change, participation rate, government policies effecting labor mobility, job vacancy information and labor retraining programs.
The Phillips Curve and the NAIRU:
The Non Accelerating Inflation Rate of Unemployment is the level of unemployment at which inflationary pressures in the economy are stable. According to supply-side economists, unemployment cannot be held permanently below its natural rate. If actual unemployment falls below its natural rate (equilibrium unemployment) there is upward pressure on wage inflation that then feeds into general price inflation. As unemployment falls towards the NAIRU skill shortages exert upward pressure on wages and producer prices, until any further falls in unemployment lead to future higher inflation.
This relationship between the levels of unemployment and the inflation rate is can be represented by the Phillips curve.
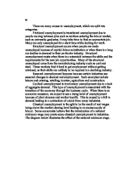
Diagram 1
The short run Phillips curve becomes inelastic and the trade off between unemployment and inflation worsens. Each short-run Phillips Curve is drawn on the assumption of a given expected rate of inflation. If there is a change in inflation expectations in the economy then the whole curve will shift upwards, as shown in the diagram above.
Most economists believe that the natural rate of unemployment has fallen in the UK over the last decade. This means that the economy can sustain a lower rate of unemployment without causing wage inflation3. The evidence from recent months proves this view of an improving trade off between unemployment and wage/price inflation. The inflation rate is within the governments target of around 2.5% and the unemployment has fallen to just over a million recently4.
Since 1993 the underlying rate of inflation has been stable and the unemployment rate has fallen steadily. There has undoubtedly been an improvement in the trade off between unemployment and inflation resulting from a reduction in the natural rate of unemployment and the NAIRU.
This is partly the result of lower price inflation itself, because a fall in inflation means that workers are more likely to accept basic pay settlements that do not threaten a resurgence in prices. Another factor has been the beneficial effects of a more flexible labor market and the long-term effects of increase in education and training spending plus special employment measures in getting some of the structurally and frictionally unemployed back to work.
Unemployment Study:
Male unemployment in Britain has risen from around ILO 2% in the 1950’s to around 11% in the 80’s (see below). According to the Classical viewpoint unemployment was too high because real wages were too high. Alternatively the Keynesians argue that wages are not binding and unemployment was high because the product market did not clear, with prices above the market clearing rate. However, markets are assumed to be competitive and prices within these markets must be determined by external forces, if at the existing prices fails to clear the markets. So therefore it is likely that unemployment was rife because wages were maintained artificially above the equilibrium level, thus preventing firms to hire more labor.
This argument is supported by a study of the labor market in the early 60s and 70s. Then it was widely believed that Britain was suffering from a shortage of skilled labor. This was most evident when governments were trying to raise the levels of economic growth but found that growth was inhibited by the skill gap. Employers complained of skill ‘bottlenecks’ which compelled them to pay higher wages in order to keep their best employees. As a result wage rates rose, causing unemployment and loss of competitiveness in trade. Furthermore, the economy suffered, as others, from the oil shocks in the 70’s. The Business Cycle theorist argue that 70% of post war business cycles were caused by supply shocks. Supply shocks have an adverse effect on AS. This caused unemployment to rise, which led to a fall in consumption and investment, causing a shift in AD.
Table 1
Year (ILO) Unemployment Rate (%) Growth in Employment (%) Growth in GDP (%)
1956-66 2.5* --- ---
1976-74 3.4* --- ---
1975-79 5.8* --- ---
1980-82 10.9* --- ---
1982-91 9* 0.7 2.4
1992-2001 6.6* 0.3 2.5
1992 9.6 -2.8 -0.3
1993 10.2 -0.7 2.1
1994 9.2 0.8 4.0
1995 8.0 0.9 2.4
1996 7.3 1.0 2.2
1997 5.5 1.9 4.6
1998 4.7 1.5 2.5
1999 4.3 0.7 1.9
2000 3.9 0.2 2.9
2001 4.0 ---- 2.7
Source: www.IMF.org
*Average
The recession in the 80’s was caused by a lack of consumer confidence, which caused many to cut consumption and increase savings. However, this led to a downturn in the economy causing a recession. The unemployment figures peeked around this time, after which they declined sharply. This was a as result of government efforts to raise consumer spending by cutting taxes and lowering interest rates for investment.
However, as a result of the ‘Black Wednesday’ and the subsequent interest rate hikes, unemployment in 92/93 hovered around ILO 9%-10%. Growth in employment and GDP were negative for that year. The reason for this is not only the higher interest rate levels but also the uncertainty caused by them, which discouraged investment and growth of the economy. However, in the following years the economy showed signs of recovery in the as the Pound was devalued allowed exports to grow.
Unemployment continued to fall after the election of the Labor government. Although, it should be noted that growth in Employment continued to rise but at a diminishing rate. This could imply that the economy is reaching its current level of full employment. According to the OECD estimates the UK’s NAIRU is around ILO 6% (unemployment). Theoretically if unemployment falls below this level it could create unsustainable inflationary pressures on the economy. However, from recent evidence it is clear that currently the level of unemployment and inflation are both within government targets.
One major change to have taken place over the years is the growing participation by women in the work force. Over the past 20 years the proportion of adult women who are economically active has risen, while that for men has declined steadily. These trends are expected to continue and by 2006 it is expected that the economic activity rate for women will be around 75%. The transformation can largely be attributed to the rising economic activity among women with children. In early 1970s there was a very marked difference between women with children and other women in terms of their labor market behavior. This is much less the case now and women with dependant children are more likely to be working than not.
In 1994 women made up no less than 45 per cent of officially recorded employees compared with 39 per cent in 1975. If account is taken of the many women working in the informal economy, for instance as unregistered cleaners or child minders, then the actual proportion of women in the work-force may even be higher than this. While men's economic activity rate declined from 90.2 per cent in 1975 to 80.9 per cent in 1994, the comparable rate for women rose from 55 per cent to 64.6 per cent over the same period. While the male rate is still somewhat higher, there is clearly a strong convergence between the two.
In spring 2000 women represented 44 per cent of the total working age labor force, an increase of nearly one and a half percentage points in the last ten years. Women's economic activity rate has changed over the last fifteen years, reaching a high of 73 per cent in spring 2000, while the activity rate for men represents an overall downward trend over the same period, a decrease of almost four percentage points.
Much of the increase in the number of women in paid work can be accounted for by the rise of part time work (between 1971 and 1993, 93% of the total increase in women’s employment was in part time work). Also the increase in women's participation rate can be attributed to the recovery (after the oil crisis) and the overall growth in the sectors that employ greater numbers of female workers (service sector), hence reducing their unemployment rate relative to the men.
In 1980 women earned 62% of men’s weekly earning, by 1999 this figure has risen to 74%. The New Earning Survey shows that women on average make less hourly pay because on average they work less hours, as the proportion of female part-timers is higher than for males. In July 1999 6.3 million women worked fulltime and 5.35 million worked part-time. However, the gap between the pay earned by women and men has been steadily declining.
The main reason for this is that there has been a long-term increase in the number of well-qualified women entering the labor market after completing further and higher education courses. Secondly over two thirds of women now return to employment after maternity leave and thus mange to avoid the loss of pay that results from delayed entry back into employment. And finally, the recent introduction of the National Minimum wage in 1998 has boosted the hourly pay of some of the lowest paid workers in the labor force.
According to the 2000 LFS (ILO), there are 600,000 unemployed women of working age in the UK, 4.9 per cent. The equivalent rate for men is 6.1 per cent. Such rates represent the lowest figures for persons of working age since the ILO measure was adopted in 1984. One reason why women have lower unemployment rates than men is that they tend to remain unemployed for less time than men. In spring 2000 45 per cent of all women who were ILO unemployed had been out of work and looking for a job for less than three months, compared with 33 per cent of men. Conversely, 19 per cent had been unemployed for one year or more compared with 34 per cent of all men.
ILO unemployment rates for women falls as age increases, from 10 per cent for 16-24 year old women to 3 per cent for those aged 40 and over. Among young women with children, the unemployment rate rises to 22 per cent, more than double the rate for those without children. By comparison, the unemployment rate for men range from 13 per cent for those aged 16-24 to a low rate of 4 per cent for the 40-49 age group.
Unemployment rates have been calculated for married and non-married men at 4 per cent and 11 per cent respectively, and for women (without dependent children) at 2 per cent and 8 per cent respectively. The rate for non-married women with dependent children at 14 per cent is higher than for non-married women without dependent children at 8 per cent. At least some of these differences are due to the different age distributions of these categories. In all, 63 per cent of unemployed women with dependent children were looking specifically for part-time work in spring 2000, compared with 33 per cent of women with out dependent children and only 11 per cent of men.
However, the British statistics conceal widespread hidden unemployment among women. This is caused by two related factors. The first is that there are many (especially older) women who are not eligible for unemployment benefit. This is because in the past (before 1978) they paid reduced 'married women's' insurance contributions, or they have not been in recent paid work and are supported financially by their partners, or because their periods of paid work have been too discontinuous. There is no incentive for these women to register formally at unemployment offices. The second is that even when they have registered, they must satisfy the official that they are 'genuinely seeking work' in order to be regarded as 'job-seekers'. This requirement is difficult to meet for women with caring responsibilities, as without an income they cannot afford to make arrangements in readiness for a job.
Bibliography
Amin Rajan and Richard Pearson (1987) UK Occupation and Employment Trends to 1990: An employer-based study of the trends and their underlysing causes, London, Anchor Brendon Ltd
Catherine Hakim (1998) Social change and innovation in the labor market, USA, Pxford University Press
Elizabeth M. Meehan (1985) Women’s right to work: Campaigns and Policy in Britain and the US, London Macmillan Publishers Ltd
Gertjan de Goot and Marlou Sachrover (1995) Women workers and Technological change in Europe in the 19th and 20th centuries, London, Taylor & Francis
Geske Dijkstra and Janneka Planlenga (1997) Gender and Economics, London, Routledge
Jack Harvey (2000) Mastering Economics 5th edition, London, Macmillan Press Ltd
John Hudson (1988) Unemployment after Keynes, USA, St Martin’s Pres Inc
Michael Parkin and Robin Bade (1983) Modern Macroeconomics 2nd edition, Oxford, Philip Allan Publishers Ltd
N. Mankiw (2000) Macro Economics 4th edition, USA, R. R. Donnelly & Sons
Pamela Sharpe (1998) Women’s work: The English experience 1850-1914, London, Hodder Headline Group
1 Michael Parkin and Robin Bade (1983) Modern Macroeconomics 2nd edition, Oxford, Philip Allan Publishers Ltd, pg23
2 Jack Harvey (2000) Mastering Economics 5th edition, London, Macmillan Press Ltd, pg268
3 Amin Rajan and Richard Pearson (1987) UK Occupation and Employment Trends to 1990: An employer-based study of the trends and their underlysing causes, London, Anchor Brendon Ltd , pg 150
4 http://www.statistics.gov.uk/ukin_figs/data_labor.as