Using an appropriate diagram explain how a government may attempt to close a deflationary gap.
Using an appropriate diagram explain how a government may attempt to close a deflationary gap.
Inflation is a sustained general increase in the level of prices. The level of inflation may be 3% per annum, which means that $100 will buy 3% less goods next year than it does now. The opposite of inflation is deflation. This technically means that the price level, or the average prices of goods and services in an economy, is decreasing. In effect, this means that money is worth more over time. However, the word deflation has gained another meaning, and is more often used to describe a situation where an economy’s output growth is slowing.
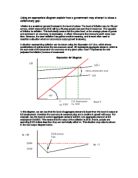
A situation representing deflation can be drawn using the Keynesian 45° Line, which shows combinations of points where the two axes are equal. AD represents aggregate demand, which is the sum total of all demands in the economy at any given price. Real Y represents the real (adjusted for inflation) income of consumers.

This is a preview of the whole essay
Peer Reviews
Here's what a star student thought of this essay
Quality of writing
The structure here is fine, having a clear introduction. I would've liked to have seen some attempt at a conclusion, weaving the argument together and posing a justified judgement. Although the question doesn't prompt for an evaluative response, a conclusion is often a good place to make a passing comment. Technical terms are used fluently throughout, and the style allows for a convincing argument. It was a shame that some of the points don't upon the analysis to answer question! Spelling, punctuation and grammar are fine.
Level of analysis
The analysis here is sound. There is a strong awareness of how aggregate demand and supply are at equilibrium to give the level of output, and why this is below the level of full employment. Building a good foundation of knowledge early on allows you to move swiftly into analysis. I particularly liked the historic example of Japan investing in infrastructure, as this shows the ability to apply theory to real life situations. It was great to see a perceptive comment that an increase in government spending isn't always matched by increases in taxation, as a government may choose to run a budget deficit. The multiplier is always a tricky concept, and this essay explores it well. There is a clear definition, and some numerical analysis. I would've liked to have seen some discussion of the significance of the multiplier, showing how a small increase in government spending can help reduce the deflationary gap. It seems as if the argument moves away from the question near the end - it is vital to stay on focus.
Response to question
This essay responds to the question well, but only after the first paragraph. The introduction gives an unnecessary definition and summary of inflation, which is irrelevant here. It is a common mistake to think of a question regarding the deflationary gap as a question about inflation and deflation, whereas it is looking for a discussion of how to move output to full employment levels. Past the introduction, this essay does engage well with this task, looking at how the multiplier and government spending can influence. Diagrams have not transferred over, but by looking at the comments, they seem to be relevant. In a question such as this, it is vital to include diagrams as this is the easiest way to define a deflationary gap and look at policies to reduce it.