Field research has the advantage that the firm itself has control over the whole process. The disadvantages are that it takes longer, and costs more.
Secondary or desk research
This is the use of existing data that has already been collected. It can be anything from a company's own sales statistics to Department of Trade and Industry reports. Other secondary sources of information include journals, company reports, government statistics, and surveys published by research organisations.
Traditionally, these have been paper-based, but more and more information is now available on CD-ROM or on-line through the Internet. Desk research has the advantages of being cheaper and quicker than field research. The disadvantages are not knowing if the findings are accurate, or how relevant they will be to your product.
Results from Primary Research
The type of primary research technique that I used was questionnaires
(Evidence of questionnaires have been collected can be found in Appendices 1)
Here are the results that I obtained from my primary research.
Results from Primary Research
In this section I will be representing my results and see what they show after asking people. I asked a series of questions that related to the budget. Her are my results
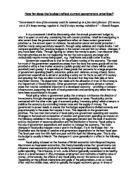
Question 1
What age are you?
Under16
16-25
26-35
35-40
40 and over
From this graph that we can see that most of the people that I interviewed were in the age category of 26-35. We can also see that very few people that I interviewed were in both the 35-40 and 40 and over category. This graph tell us that 5055 of the people were in the age category of 26-35.
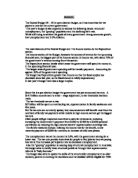
Question 2
What is your main source of employment?
Employment
Any kind of benefit
Self employment
A combination of the following
Other
This graph can tell us many things. Firstly it tells us that the people that I interviewed were in some sort of employment. It also tells us that a small number were receiving some kind of benefits and also a small amount was also receiving some other type of employment can also see that 79% were in some of sort of employment while only 10?% were receiving some sort of benefits.
Question 3
Are you
Married
Or
Single
This graph simply shows that the people that I interviewed were mostly married in fact 57% were married and 43% of the people were not married.
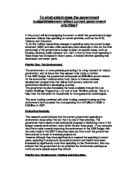
Question 4
How many children do you have under the age of 16?
This pie chart tells that many people that I interviewed had no children under the age of 16 only a small proportion of people had 2 children under the age of 16. In fact 57 of the people had no children and 36% had 1 child under the age of 16 in their household.
Question 5
Part 1
Do you smoke?
This graph simply tells us that mostly the people that I interviewed did not smoke and only a small minority did smoke. 79% of the people that I interviewed did not smoke only 21% of the people that I interviewed did not smoke.
Question 5
Part 2
Do you drive a car?
This graph tells us that most people drive a car that I interviewed and a small number of people did not drive a car. 64% of the people that I interviewed drove a car and 36% of the people that I interviewed did not drive a car.
Question 5
Part Three
Do you travel by air?
This graph tells us that more people that I interviewed traveled by air and only a small number had not flown by air. We can see that 79%of the people had flown by air and only 12% had not traveled by air.
Question 6
Do you have your own home?
We can see that a small percentage of people that I interviewed did not have their own home this percentage was 57% and only 43% of the people that I interviewed did not own their home.
Question 7
Which of the following public services do you use?
NHS
Schools
London Underground
Fire Brigade
Police
Ambulance Service
We can see that most people use most of all the public services provided. The most common used public services are the NHS and the London Underground. The least used public services are the Ambulance Service and The Fire Brigade.
Question 8
How do you rate these services above
Very Good
Good
Acceptable
Less than acceptable
This graph tells us that the people that I interviewed thought that the public services quoted above are “acceptable”. The percentage of people that thought that the public services above were acceptable is 57% and 36% of the people thought that the public services above were “good”. Only 7% of the interviewed people though that public services were very “good’.
Question 9
Do you think that you pay?
Too much tax
The right amount of tax
Too little tax
Most of the people that I interviewed though that they pay too much tax. Only a small minority though that we pay too little tax. We can see that any people hardly thought that they pay the right amount of tax.
Question 10
Do you think that you benefited form the budget?
Yes
Or
No
We can see that from the last budget that most people though that they did not benefit from the budget and only a small number of people that I interviewed thought that they did benefit from the budget
Results from Secondary Research
Theory Section
The budget fore casts of expenditure and revenue for a specific period of time. As a planning document, a budget enables businesses, governments, private organization and households to set out priorities and monitor progress towards selected goals. To achieve this budgetary objective, it may be necessary to set aside savings (surpluses) or to borrow from outside sources.
Fiscal Policy
The national budget also expresses the government’s fiscal policy. Governments are faced with numerous, often conflicting, objectives: promoting maximum employment, fighting inflation and pursuing economic stability and growth. Fiscal policy is the government’s policy in relation to taxation and public spending. When taxation is reduced or public expenditure is increased with the aim of stimulating aggregate demand, fiscal policy is said to be loosened. When taxation is increased or public expenditure is reduced fiscal policy is said to have tightened.
Conclusion and Evaluation
From my results I can conclude many things. Firstly we can see that some people haven’t benefited from the budget and some haven’t. On the other hand some people have benefited from the budget but yet do not know they have benefited from the budget.
Now I will look at how different people have benefited or not.
Firstly I will be looking at people that drink and smoke and see what the budget has done for them. People that drink beer and wine the tax on these went up by a total of 5p but on the other hand people that drink spirits still have to pay tax but by the same amount this is called Tax Frozen.
People that smoke would of seen an 8p increases in cigarettes but this does not matter this is due to the elasticity of demand. IF the product is priced inelastic it is a bad idea to increase the price. This does not matter if the government increases the tax on cigarettes as smokers will still buy the cigarettes because to some it is a necessity and to most smokers it is addictive.
We can also see that people that receive a fixed income they receive the same amount of tax they did before because income tax stays the same. Others that have benefited from the budget are people that play Bingo as the tax that is paid is going to be abolished.
Pensioners over the age of 80 also have benefited because they will receive an extra ₤100 annually meaning that they will gain the most.
In my opinion would say that the government has not looked at everyone and I think that they have set targets that suit everyone and I would say that the government should rethink their objectives. I would recommend to the government any things:
- They should think more about people that are employed
- They should spend the money gained from taxes that will be of use to everyone such as hospitals and roads building.
- I would also like to recommend that young people are taken into consideration
In order for me to improve, coursework I could of done many things . If I could improve I should of haven more time so this means that theresults that I got would be more accurate. If I had more resources such as other books and this could have improved my coursework.
There were also some problems for me to complete this coursework this is because my computer broke down meaning that I had to some of the coursework again meaning that the original version could have been better.
Bibliography
To complete this coursework I have used many sources such has books and internet sites. Here are the following sources which I have used
- Encarta ( Encyclopedia CD ROM)
-
(Website)
-
(Website)
-
(Website)
- Economics : A Complete Course Oxford Express ( Textbook)
- Economics At GCSE Darren Anderton (Textbook)
- www.taxcentral.co.uk