There was of course a certain degree of experimental error in our results as I have explained, and it must be remembered that we only used twenty-five of the settlements on the Ards Peninsula for this hypothesis.
Nevertheless, I strongly believe that this result is a fair reflection of the trend for the whole of the Ards Peninsula, even with experimental error taken into account.
I am pleased with this sub-hypothesis because I used the graph from it as a basis to determine a hierarchy based on the size of the settlements which goes a long way to solving my main hypothesis.
HYPOTHESIS 2
“Is there a functional hierarchy on the Ards Peninsula?”
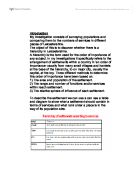
AIMS:
My aims for this hypothesis are firstly to find the centrality values and indices for the settlements that we visited, and present them on a matrix. I then hope to see a connection between centrality index and centrality rank as I did for population.
I expect to find that the settlements with the larger centrality index will be at coastal locations.
METHODOLOGY:
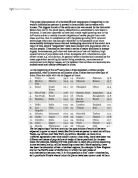
Centrality index, in other words the range of services a settlement provides, is calculated by adding up the number of a particular service in a particular settlement and putting this data into a matrix (see appendix).
If we take the example of Ballyboley, there is one church and so if one reads down the Ballyboley column, at the church row there is placed a 1. This is then added on to the total number of churches on the Ards Peninsula, which gives the total of 27. This is in turn divided into 100, which gives the centrality value of a church as 4.
When this process has been carried out for every service, the total centrality index can be calculated. This is simply done by adding all the centrality values of a particular settlement together, in the case of Ballyboley it is 13.
PROBLEMS:
The main problem we had to deal with regarded multi-function services. For example a mini-market which was also a lawnmower supplier and a Post Office which was also a bank.
In most cases we counted them as separate services, but in more obscure cases we counted them as one service.
Another problem we faced was missing out hidden post boxes! Although even if we did miss one or two it would have little impact on our overall results. The main way we made sure our results were correct was to compare them during class with other results.
A problem that we faced, was whether to count lifeboat stations and aquaria. We decided not to count them because, not all of the settlements that we visited were at coastal locations, and so it wasn’t possible for the settlement to provide these services.
Also, aquaria are rare. The Exploris Aquarium in Portaferry is one of the only a handful in Northern Ireland, so that particular service doesn’t show the average trend of the hierarchy of the functions on the Ards Peninsula.
HYPOTHESIS 2
TABLE
With this data I am able to plot a graph to see if there are any patterns for the functions of the settlements we visited.
HYPOTHESIS 2
INTERPRETATION
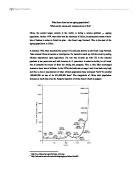
The graph shows that there is a relationship between Centrality Index and Centrality Rank. It shows that the settlements with the larger Centrality indices are spaced out whereas the settlements with low Centrality Indices are close together.
One reason for this is that the top ten settlements ranked by Centrality Index are at coastal locations with the exception of Carrowdore and Glastry.
I believe that Glastry has a high Centrality Index because it is right in the centre of the peninsula, and if we look closely at its services, we see that it has vets and doctors explaining the high Centrality Index
This proves the point that since it is in the middle of the peninsula, it provides services for other settlements all over the rest of the Ards Peninsula.
The settlements ranked 11 to 25 are inland and to get to them one has to travel along little, windy roads, whereas the settlements ranked 1 to 10 are generally on the coast and easy to get to by good coastal roads.
Another point that can be shown on this graph is that it shows there is a functional hierarchy on the Ards Peninsula by showing the levels in which settlements are arranged.
This graph suggests that the smaller the Centrality Index, the smaller the settlement. This is because a small settlement doesn’t need to provide a large number of services for a small number of inhabitants. This gives us substance for further investigation.
HYPOTHESIS 2
CONCLUSION
I am very pleased with this hypothesis because I have found that a functional hierarchy exists on the Ards Peninsula.
I have also noticed a pattern, that the smaller the settlement the smaller the centrality index, which will lead me on to investigate other sub-hypotheses.
This sub-hypothesis takes my investigation a step closer to solving my main hypothesis.
HYPOTHESIS 3
“Is there a correlation between the population hierarchy and the functional hierarchy on the Ards Peninsula?”
AIMS:
My aims for this hypothesis are firstly, to see if there is a correlation between population and centrality index on the Ards Peninsula, which I think there should be. If there is a correlation then I will determine the strength of the correlation using Spearman’s Rank test.
METHODOLOGY:
To find the population of the settlements I used census data and the method of counting houses as we drove slowly through the settlements, as I mentioned before in Hypothesis 1.
For Centrality index, I calculated the centrality values and then added all of the values for each settlement together, also previously mentioned in Hypothesis 2, this data was then put into a matrix (see appendix).
PROBLEMS:
For fear of repeating myself I will not describe them all again, but it must be noted that although a house or two may have been missed and the census data may have been out of date, it should not make a drastic difference to my final result.
Also, the decision of whether to count a multi-functional service as one or separate functions was taken after much thought, and emerged to show each service as a separate function.
HYPOTHESIS 3
TABLE
With this information I will now plot a graph to highlight any patterns between the two sets of data.
HYPOTHESIS 3
GRAPH
HYPOTHESIS 3
SPEARMAN’S RANK TEST
HYPOTHESIS 3
SPEARMAN’S RANK TEST (Contd.)
To find the type of correlation we are dealing with, we have to use the following formula:
Key:
= (sigma) the sum of…
= difference squared
= number of settlements
The answer derived should be between +1 and –1, +1 being strongly positive and –1 being strongly negative.
Using the formula shown above I shall work out the strength of the correlation for this hypothesis comparing the functional and population hierarchies of the Ards Peninsula.
We can now see that the correlation for the two hierarchies is+0.84 which can be rounded down to +0.8.
HYPOTHESIS 3
INTERPRETATION
Using the information from the matrix sheet and the census data, I was able to draw a scatter graph to show the correlation between population and Centrality Index.
The graph showed us that there is a positive correlation, in that as population rises so does Centrality Index. In other words there is a direct correlation.
The Spearman’s Rank Test showed us that we have a correlation of strength +0.8. This is a result of high positive strength with +1 being the strongest positive correlation.
When I found my result of +0.8 I was slightly disappointed, as I expected it to be a little higher, but then I took into account the fact that there are residual results. For example, Glastry has the population of 76 (rank 14/25) and a Centrality index of 265 (rank 7).
This shows that Glastry has a small population but a high Centrality Index. The reason for this is because it is in the centre of the Peninsula and therefore provides services such as schools and veterinary clinics, which are relatively rare to other parts of the Peninsula.
The opposite of this is seen in Ebenezer, which has the population of 58 (rank16/25) and the Centrality Index of 9 (rank 22/25).
Here we see that a settlement with a large population and yet has a very low Centrality Index.
A reason for this can be found by looking at a map of the Peninsula and one will see that it is very near Portavogie which provides a lot of services. Therefore the reason Ebenezer has such a low Centrality Index is because there is simply no need for a great deal of services when Portavogie is nearby. This gives me substance to carry my investigation further.
Using the data in the table I was able to represent the differences between population and centrality index cartographically.
This map shows the spheres of influence each settlement has, both centrality and population-wise. It was drawn using the top six settlements with the largest populations and using the top eight settlements with the largest Centrality Indices.
The map shows similarities and differences between settlements very clearly. For example, it shows that Millisle has a larger population than Centrality Index and is therefore underdeveloped, whereas Glastry has a larger Centrality Index than population, because it did not feature in the top six settlements for population.
The map not only shows under and over development, but settlements that have the ‘right’ amount of services for the size of the population.
HYPOTHESIS 3
CONCLUSION
I am very pleased with this Hypothesis because I used data from a table and presented it in the form of a scatter graph to show that there is a positive correlation between Centrality Index and population. Using the Spearman’s Rank Test I found the strength of the correlation between the two hierarchies.
I was able to represent the data on a map, which made it easier to see the similarities and differences between the Centrality Index and population of the settlements on the Peninsula.
Now I can say there is a direct correlation between Centrality Index and population. In other words that as the population of a settlement increases, the Centrality Index will increase, because there will be enough demand to sustain more shops and services.
This sub-hypothesis has also shown me that some settlements do not provide lots of services for the population due to other settlements with a greater number of services being near by.
This will be investigated further on in my investigation.
HYPOTHESIS 4
“Do people travel further for higher order goods?”
AIMS:
My main aim for this sub-hypothesis is to find out if people do travel further for higher order goods using the example of people in Portaferry.
METHODOLOGY:
Before I investigated if people travel further for higher goods or not, I had to find out where people purchase items such as bread, televisions etc. To do this, our group set about a questionnaire (shown on following page).
Once all 28 surveys had been completed we added them to give us overall results of where people go to buy different goods and how often they would visit some of the much larger settlements, which are considerable distances from Portaferry.
Once the data was added we took percentages for reasons stated in the ‘problems’ section.
PROBLEMS:
The main problem concerning the questionnaire was that not all of our results added up to 28, as they should have done.
The reasons for this were quite straightforward, in that some of the people surveyed gave more than one answer to the questions.
For example, they didn’t have a car, they ate out or bought bread in more than one place. This problem was overcome by taking percentages of our results.
Another point which should be noted regarding the question:
‘ How often would you visit the following places –Belfast, N’ards, Downpatrick?’
It must be remembered that to get to Downpatrick, the inhabitants of Portaferry must pay £3.50 to use the ferry, which travels across Strangford Lough. This factor does affect the decision of where to go to buy goods when Newtownards is a 20-minute drive away.
I believe that the combined factors of the actual price of the goods, the price of travelling to the destination and the distance will have the greater effect on where people go to buy goods rather than the distance alone.
HYPOTHESIS 4
TABLE
With this information I can draw charts to show the data more clearly.
HYPOTHESIS 4
TABLE 2
With this data I can draw charts to show the information more clearly.
We can see from this that the further away the settlement, the fewer people go to it.
HYPOTHESIS 4
INTERPRETATION
The graphs and charts representing the data in table 1 show that almost every person questioned would buy their bread in Portaferry whereas only 4% of people would go to the dentist in Portaferry. This proves the point that people travel further for higher order goods.
Table 2 shows us that overall more people would visit Newtownards than Downpatrick. This indicates that people will only travel so far for higher order goods depending on the factors influencing their decision, such as the price of the ferry and of the time it would take to get there.
Table 2 also shows that Downpatrick is the least popular destination in competition with Newtownards and Belfast.
It is interesting that although Belfast is the capital city and therefore more likely to have a greater variety of shops and services, that more people would travel to Newtownards.
I suggest that Downpatrick is the least popular because the only easy way to get to it is via the ferry which costs more money.
From the graphs I also suggest that Newtownards is more popular than Belfast. It is also the most popular destination overall because it is closer to Portaferry, the easiest to get to and the route from Portaferry to Newtownards is on a good road.
From studying all of the charts and results in this sub-hypothesis, I can say that people do travel further for higher order goods.
Furthermore, I can also say that people will choose the easiest route possible to get to their destination, which may in the end be the deciding factor.
HYPOTHESIS 4
CONCLUSION
I am pleased with this sub-hypothesis because I have found that people do travel further for higher order goods and also that there are factors which will in the end have a great affect on the decision of where to go to buy the goods.
In this hypothesis I have found many things which aid my understanding of the overall hierarchy of the Ards Peninsula, in that the number of services a settlement has is not the only factor that encourages people to go there.
I have also found that distance is a large factor that influences decisions of where to go to buy things. This is an interesting idea and will be investigated further on in this study.
HYPOTHESIS 5
“Is the distance between settlements greater for higher order settlements than smaller settlements?”
AIMS:
My main aim for this hypothesis is to find out if there is a bigger distance between larger settlements.
I will also compare two settlements of medium rank to highlight any differences between them, one being on the West side and the other on the East side of the peninsula.
METHODOLOGY:
To measure the distance between each settlement, I used a ruler to measure the straight-line distance from settlement to settlement. I then put the data into a table and plotted the distances onto a different map to make it easier to see.
To compare Ballywalter and Kircubbin, firstly I had to walk around the settlements and record what shops there were and any other services the towns had. From the list of services for each settlement I am able to see the differences between the two towns and note the reasons why these differences occurred.
PROBLEMS:
It must be noted that I am only using certain settlements for this hypothesis and therefore I am leaving out a significant number of settlements so in some ways having a great affect on the validity of my results.
Another problem that I encountered regarded the recording of shops and services for Ballywalter and Kircubbin. If I missed even one or two services it could affect my overall result.
Also, where some shops were concerned, it was not only difficult to tell how many functions they contained but also if they were still in business.
HYPOTHESIS 5
TABLE 1
With the information in the table above it is clear that those towns that are larger in size have greater distances between them.
From this table I can see a rogue result. One would expect the distance from Ballywalter to Kircubbin to be greater.
To investigate this further I will include the town maps of the two settlements, Ballywalter and Kircubbin, which I am studying in greater detail. I will also make a list of all the services that Ballywalter and Kircubbin have. This will resolve why the distance is small for the size of the settlement.
HYPOTHESIS 5
TABLE 2
The Centrality Index of Ballywalter is 770 and the Centrality Index of Kircubbin is 987.
HYPOTHESIS 5
INTERPRETATION
Table 1 shows us that this hypothesis is correct, in that the higher order settlements are further apart than the lower order settlements.
Of course there was the exception of Kircubbin and Ballywalter which were not as far apart as one would expect.
From the table and the maps it can plainly be seen that Ballywalter has a smaller Centrality index than Kircubbin. This is strange, because Ballywalter has a bigger population than Kircubbin.
I suggest the reason for this is because Kircubbin’s main street is on the road down to Portaferry, whereas Ballywalter’s main street is not located on such a busy through road.
The reason why Kircubbin has a much larger Centrality Index than Ballywalter is because Kircubbin has several very high order services, which Ballywalter could not have. This is because the settlements close together meaning that if for example there was a fleshers in Ballywalter as well as Kircubbin, th two would not stay in business.
Both towns are coastal, which makes the comparison fair in that coastal locations are more popular than inland locations, as discussed in previous hypotheses.
The reason that the two settlements are closer together than would normally be expected for settlements of their size is that they are both half way down the peninsula and both at coastal locations.
It must be remembered that the Ards Peninsula is quite narrow, and physically, the two settlements are as far apart as they can be.
Also, it must be noted that the two settlements are approximately the same distance from Portaferry, which explains why they are similar in the hierarchy of the Ards Peninsula.
HYPOTHESIS 5
CONCLUSION
I am pleased with this sub-hypothesis as I have shown that the higher order settlements are further apart than the smaller settlements.
I have also been able to compare two similar settlements, Ballywalter and Kircubbin, to find out why they are not as far apart as one would expect.
This sub-hypothesis leads me to sub-hypothesis 6 of the Breaking Point theory.
HYPOTHESIS 6
“Can the Breaking Point theory be applied to the Ards Peninsula?”
AIMS:
The aim of this sub-hypothesis is to work out the relative spheres of influence for several of the larger settlements of the Ards Peninsula.
I am only taking a small sample of settlements on the Ards Peninsula and so the results I achieve may not be the best reflection of the actual spheres of influence (see problems). Therefore it must be noted that one of the main aims is to gain a greater understanding of the Breaking Point theory and achieve results which are as accurate as possible, rather than to obtain perfect results.
METHODOLOGY:
In order to put the Breaking Point theory to use I firstly had to measure the straight-line distance between the settlements chosen and their nearest neighbour in the North, South, East and West.
I then collated the population data for these various settlements, thus enabling me to use the mathematical formula of Breaking Point theory. (See theoretical basis.)
PROBLEMS:
As mentioned above, this sub-hypothesis is concerned with only six of the largest settlements for the test, and so I am leaving out a great number of settlements and their spheres of influence. This will obviously have a significant effect on the validity of the results, but it will be interesting to see the results achieved using only the top six settlements.
Another problem is that I have only taken into account the settlements nearest neighbours in the four cardinal compass points.
In order to obtain proper results it would be necessary to work out the sphere of influence for every settlement on the Ards Peninsula.
THEORETICAL BASIS
The principles behind Breaking Point Theory are very straight- forward. It is simply used to calculate the distance between two settlements, which divides those people who will travel to one settlement from those who will travel to another for similar services. This is known as a breaking point. If enough breaking points can be established a theoretical sphere of influence can be achieved.
The breaking point between two settlements is calculated using the following mathematical formula:
Therefore, if we are calculating for example, the breaking point between Portaferry (pop. 2324) and Cloughy (pop. 647).
The distance between the two is 6.75km, and when the formula is applied:
The result is 2.33km. This means that the breaking point between Portaferry and Cloughy is 2.33km from Cloughy, which is the smaller settlement.
HYPOTHESIS 6
TABLE
By applying the mathematical formula shown on the previous page, I will obtain Breaking Point values for various settlements of the Ards Peninsula.
Using the information in this table I shall put the values onto a map of the Ards Peninsula and shall hopefully see the spheres of influence emerge for the range of settlements.
HYPOTHESIS 6
INTERPRETATION
The map above was drawn, by plotting all the breaking points of the settlements and the various breaking points for each settlement were joined.
I then coloured in the circles to make it easier to see the spheres of influence for each settlement.
As I expected, Portaferry has the largest sphere of influence.
This is due to it having the largest Centrality Index, thus having the largest range of goods and services. However, the Breaking Point Theory doesn’t take Centrality Index into account, only population. Portaferry also has the largest population, which explains this result.
One would expect Portavogie to have the second largest sphere of influence if one goes on the theory that the larger the population, the larger the sphere of influence. Indeed, it might have the second largest sphere of influence.
The simple fact is that it is impossible to tell from my set of results to which settlement(s) the area of land which is unaccounted for belongs.
In my opinion, it is likely to be divided between Portavogie and Kircubbin with perhaps the larger proportion going to Portavogie. This is due to the road system. Not because of distances, but because from the major roads on the Ards Peninsula, which I have marked on the map, it is clear that it is much easier for people living in the unaccounted area to get to Portavogie than to Kircubbin.
With this in mind, I think it would not be fair to say that Portavogie would in theory have a larger sphere of influence than Kircubbin.
The other two settlements for which their spheres of influence are fairly unclear are Ballywalter and Greyabbey.
Both their spheres of influence are likely to be bigger if they follow the pattern of the other settlements on the Ards Peninsula. Again, it is impossible to elaborate on the actual size of their spheres of influence with the data I have.
Therefore, we could say that we have found rough spheres of influence for six of the larger settlements on the Ards Peninsula, in a very simplified form, of course.
I say rough, as not all the spheres of influence are complete.
It must be noted that there is only a sample of six settlements in this test, but there are many more which would make a significant difference to the overall picture of spheres of influence on the Ards Peninsula.
I estimate the relative sizes for the spheres of influence are as follows ranked in descending order:
- Portaferry
- Portavogie
- Kircubbin
- Ballywalter
- Cloughy
- Greyabbey
This order is to be expected if the spheres of influence followed the pattern of a direct link with their population i.e.,
the settlement with the largest sphere of influence = settlement with the largest population.
The only exception to this rule would be Cloughy and Greyabbey. One would expect Greyabbey to be ahead of Cloughy if the rule I have stated above were to be believed.
In fact, Greyabbey’s sphere of influence is probably larger than that stated, but because it is impossible to tell exactly how large its sphere of influence is from my set of results, I have had to guess. So again it must be remembered that my results are inaccurate in certain areas, but I do believe this rule to be fair.
Indeed the use of population as an indicator for the sphere of influence is in itself questionable. However, I believe my results are a fair reflection of the settlements on the Ards Peninsula.
HYPOTHESIS 6
CONCLUSION
I am pleased with this sub-hypothesis because I believe that I have a greater understanding of the Breaking Point theory and I can also say that I have shown some approximate spheres of influence for six of the settlements on the Ards Peninsula.
Therefore I can say that the Breaking Point theory does apply to the Ards Peninsula.
Even though I found flaws in my results, I believe that they do not invalidate this sub-hypothesis. This is a very important factor in my main hypothesis.
MAIN HYPOTHESIS
CONCLUSION
“THERE IS A HIERARCHY OF SETTLEMENT ON THE ARDS PENINSULA”
Having solved my six sub-hypotheses directly linked to the main hypothesis I am now in a position to solve the main hypothesis.
The sub-hypotheses were:
- “Does a population hierarchy exist on the Ards Peninsula?”
- “Is there a functional hierarchy on the Ards Peninsula?”
- “Is there a correlation between the population hierarchy and the functional hierarchy?”
- “Do people travel further for higher order goods?”
- “Is the distance between settlements greater for higher order settlements than smaller settlements?”
- “Can the breaking point theory be applied to the Ards Peninsula?”
The reason why the main hypothesis is split into six parts is because settlement hierarchy cannot be solved by one particular method but rather is split into three parts:
- The population and area of the settlements
- The number and range of services the settlements provide
- The relative sphere of influence of the settlements
The six sub-hypotheses were designed with these in mind.
I am now able to say conclusively, that there is a definite hierarchy of settlement on the Ards Peninsula.
I base this on the findings of the six sub-hypotheses that showed the general hierarchy showing that there are population and functional hierarchies, which correlate.
For example, in graph two we saw a definite hierarchy of settlement based on the populations of the settlements.
This finding was of course inspired by the theory of the Rank Size Rule which, incidentally, we found not to apply greatly to the settlements of the Ards Peninsula.
From there I moved on to look at whether we could tell anything about the settlement hierarchy from the perspective of relative sphere of influence.
To this end I applied the Breaking Point theory to a few of the larger settlements on the Ards Peninsula. This did indeed show us several interesting things about the settlements under study.
From the map we were able to see that there was clearly a prime settlement (Portaferry).
It showed us just how much bigger Portaferry’s sphere of influence was in comparison to the other settlements.
With all these factors in mind we can now place the settlements in a hierarchy.
MAIN HYPOTHESIS
EVALUATION
“THERE IS A HIERARCHY OF SETTLEMENT ON THE ARDS PENINSULA”
In this project, having split the main hypothesis into six sub-hypotheses, and I believe that I have now proved it to a satisfactory standard.
The results I achieved for many of the hypotheses, while often inaccurate and rather simplified, do give reasonable ideas of the geography of the Ards Peninsula and the people who live there.
I believe that I have proven several pieces of geographical theory to be true of the Ards Peninsula, especially Breaking Point Theory, but also, to a lesser extent the Rank Size Rule.
It must be said that the way in which data was collected for this hypothesis does mean that some of the results are slightly inaccurate to say the least, and furthermore, for several of the sub-hypotheses only a small sample of settlements was taken.
This in itself means that for these sub-hypotheses, the results perhaps did not reflect the overall picture for all the settlements on the Ards Peninsula.
Despite all of these problems, I believe that I achieved my aims and undoubtedly developed a greater understanding of various geographical theories mentioned in this project.
In conclusion, I believe I completed this project, achieving a reasonable idea of the geographical processes and to the best of my ability.
GLOSSARY
-
SETTLEMENT HIERARCHY: This term refers to the arrangement of settlements within a certain area in “order of importance”.
-
SPHERE OF INFLUENCE: The area served by a particular settlement, it depends on the size and functions of a settlement.
-
MATRIX: A grid onto which we put the range of services of each settlement with the aim of calculating their Centrality Index. (see appendix)
-
CENTRALITY VALUE: The number of points awarded to each service depending on how common they are. Calculated by dividing 100 by the total number of a particular service.
-
CENTRALITY INDEX: How “important” a particular settlement is, based on the number and range of services provides. Calculated by multiplying the Centrality value of each service by the number of that service there are in the settlement.
BIBLIOGRAPHY
- NAME: The Wider World
- AUTHOR: David Waugh
- PUBLISHER: Nelson
- NAME: Geography- An Integrated Approach
- AUTHOR: David Waugh
- PUBLISHER: Nelson