Is any other process present and if so how active are they?
How does this relate to the main question?
What signs are there to prove deposition is active?
Are groynes present and if so are they cover with sea material?
Groynes are the first sign that shows that deposition is active. Groynes serve the purpose of solving transportation and long shore-drift.
Are there other signs of different processes, and if so are those processes more active than deposition?
It should be clear that deposition is prominent but for it to be the main process other processes have to be less active and have a smaller impact than Christchurch bay. Secondary data about coastal management has proved that erosion plays a big part in Barton on sea. So erosion is very much prominent as well.
Transportation must be present; this is proved by logical evidence. It is true that longshore-drift encourages deposition otherwise there would not be groynes to stop the build up of material on spits, from happening, but before this landform process can deposit something it must have been transported there so this shows that transportation is also present therefore both processes are present, (the main type of transportation could be traction).
Hard engineering has had a significant impact on Christchurch bay.
Why this hypothesis needs to be answered?
First, to be able to answer the question, how is Christchurch bay managed, it is important to have an insight on how attempts to manage it has turned out. Once this is known then it is possible to explain why it needs management, perhaps because the past attempts have had very little success.
Questions to help answer this hypothesis:
What signs are there of hard engineering?
Why is it there?
Which coastal problems is it trying to prevent?
Has it had any significant impact?
How can all this relate to the main question?
What signs are there of hard engineering?
Are revetments present?
According to evidence of secondary data which is what I seen .Revetments are present on Barton on sea. This means that hard engineering has been going on. It can be said that it is hard moving and placing large boulders.
Are there groynes and which problem is it trying to prevent?
Yes, groynes are present especially in Barton on sea where there is quite a lot of them. So these are the signs that show that hard engineering has been taking place. These costal protections are trying stop deposition of material on to the spit.
Has it had any significant impact?
These particular coastal protections have certainly had some significant impact on Christchurch bay. The best example of a significant impact is the clear pictures that show one part of Barton on sea which is protected, and the other which shows a part which is not protected, forcing it to retreat 30m back in a period of 20 years. This is another reason on its own that shows why Christchurch bay needs to be managed.
In conclusion to this hypothesis it is possible to say that hard engineering has had a huge impact on Christchurch bay. But still some parts are in need of protection. This hypothesis also shows how it is managed.
Human intervention has a significant impact on Barton on Sea and Hurst Castle Spit
Why this hypothesis needs to be answered?
First, to be able to answer the question, how is Christchurch bay managed, it is important to have an insight on how attempts to manage it has turned out. Once this is known then it is possible to explain why it needs management, perhaps because the past attempts have had very little success.
Questions to help answer this hypothesis:
What signs are there of human intervention?
Why is it there?
Which coastal problems is it trying to prevent?
Has it had any significant impact?
How can all this relate to the main question?
What are the signs of human intervention?
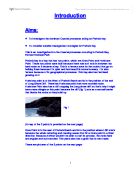
There are many signs of human intervention you can tell by the man made features which have been placed on the beaches of Hurst Castle Spit and Barton on sea, there are a number of sea defences which have put in places, these defences are shingles, groynes and huge rocks on the beach which stop the ocean current from coming in and eroding the cliffs and beaches.
The image shows Groynes in place to
Stop erosion on the beach this image is
From Barton on Sea
The image showed below shows huge rocks in place to slow down the erosion on the beach. This image is
From Hurst Castle Spit
Having all these sea defences in place
Is slowing down the reaction of erosion
And long shore drift but all the sea
Defences are just slowing down the
Reaction so that means the reaction is
Taking place but slower. This means there will not be a big significant impact on both sites.
Human intervention has had a significant impact on Barton on Sea and Christ Church Bay. This is because human lives are at risk there are two parts to this argument you allow the beached to be Eroded and lost forever or slow down and stop the eroding beaches.
This is an image of Barton on Sea
The beach and the cliff is being
Eroded, sop if human intervene
This will have a significant impact
There are two options you can stop
The eroding beaches and intervenes
Or allow nature take its way.
This image is from Barton on sea
So human intervening plays a big part to what happens to are future beaches so this hypothesis has been proven true.This image of humans who have intervened with Barton on Sea are beaches will end up like this so humans do have a big impact with the future of the beaches. They have intervened by having put huge rock as revetment, to protect the coast
In conclusion having intervened will make some impact but not much due to you can not stop the erosion and long shore drift and deposition, all the defences put in place are just slowing nature to take it’s place.
Sediment on Barton on Sea and Hurst Castle Spit are being Transported by long shore drift
Why this hypothesis needs to be answered?
First, to be able to answer the question, how is Christchurch bay managed, it is important to have an insight on how attempts to manage it has turned out. Once this is known then it is possible to explain why it needs management, perhaps because the past attempts have had very little success.
Questions to help answer this hypothesis:
What are the signs of sediment being transported on Hurst Castle Spit and Barton on Sea?
Why is sediment transport occurring?
Has it had any significant impact?
Why do pebbles vary on the spit? If yes why?
How can all this relate to the main question?
What are the signs of the sediment being transported on Hurst Castle Spit and Barton on Sea?
Sediment being transported can leave huge clues; one way of finding sediment being transported is by looking and measuring the pebbles.
By looking at this bar graph it is evident that when these pebbles were deposited, on to the spit by longshore-drift, the smaller pebbles were easier to push up the beach than the heavier pebbles. This is because the first pebble that was collected; from where the wave breaks was the biggest from the collection. Furthermore the pebbles which were collected higher up the beach were smaller.
This second analysis shows that the pebbles are all roughly of equivalent sizes, but the pebbles that are further up the beach slightly bigger, according to the results. This could have happened due to strong destructive waves, which must have eroded closer pebbles by hydraulic-action and attrition altering their shapes and sizes.
Longshore drift results
This table shows the direction of the longshore-drift and the time taken for the float to reach 10 metres. From this result it is possible to say that the waves were stronger in Hengistbury head than in Hurst castle spit, because it took less time for the wave to carry the float for 10m. This result also shows why the pebbles were smaller, from where the wave breaks in Hengistbury head. West is not the usually direction of longshore-drift but on Monday, 13/03/06 the prevailing wind direction was different.
In conclusion pebbles are being transported; if you look at the bar graph you can see the proof of the transported sediment on both of the site.
Summary of results:
The primary and secondary data that has been collected has helped to find some basic relationship in helping to prove the hypotheses. For example:
- Pebble analysis and beach profiles of Hurst castle spit shows that deposition is present, this relates with the first hypothesis
- By observing the groynes it can be said that deposition is also active
- Secondary data shows that hard engineering is expensive and revetments and groynes show that it has been protected before
- Erosion has been proved to be stronger in Hengistbury head than in Hurst castle spit
- Secondary data has also proved the need of management
Data collection
Review of the day
On the visit to Christchurch bay all three of the study sites were visited, those sites were Hengistbury head, Barton on sea and Hurst castle spit. On this trip valuable information needed to be recorded for the coursework, and different methods of data collection. For example, it was vital to learn how to measure something like the beach profile, which was learnt before hand.
Hurst castle spit was the first site which was visited. It was to some extent a remote area the population was very small. There was some calm during the visit which encouraged a peaceful and tranquil environment; despite all that as the group got nearer to the coast the weather became colder and unbearable. The spit was massive and tended to curl around which made it hard to see the end of it. Data was collected there. The type of information record had to be related to the project, so there was no time wasting. The beach profile was the first information recorded, then the longshore-drift speed, pebble analysis, EQI, field sketches and finally the museum visit.
Barton on sea was much more sunny and calmer, there were more people and the place was more populated and developed, shops and restaurants were clearly visible. There the teacher explained about erosion and pointed out how the cliffs were protected by revetments. The information recorded there was the EQI and field sketches.
The last site Hengistbury head had more green land and a very flat beach, the sea was very aggressive and only a few people were visible. The information recorded there was the beach profile, longshore drift speed, field sketches and EQI.
Method of Study
Beach Profile
Measuring Beach profile, you will need to start where the waves break on to the beach. A ranging pole is put in to the ground upright at this point with another ranging pole at the first significant change of angle or ten meters up.
Then the pebbles on the beach will be measured and recorded using clinometers (angle measure). Place the clinometers on the highest divide between the red and white band on the first ranging pole. Now you will need to look along the clinometers and tilt it until the line matches up with the same divide on the second ranging pole. The clinometers reading will be in degrees then you would record, along with the section length.
This diagram is showing how to beach profile
Pebble Analysis
If the sediment in fine this s recorded as sand. If the sediment is large twelve pebbles are collected and sampled for every ten meters up the beach or every large change in angle, starting from where the wave break to the beach. The largest and the smallest you will have to throw away now the remaining ten should be measured at their longest axis. The roundness of the pebble should be compared to the roundness.
Theses are two diagrams which show data collection, which is was collected on the of the visist.
Long Shore Drift
Place three poles parallel to the sea. There should be at least Ten meter gap between each pole. Now you will need to throw an object that will float and clearly viable in the sea .e.g. orange, there orange should now be in line with the centre line pole and now time how long it takes to be carried pas either poles. Here is how long shore drift works.
Museum visit
Secondary data:
The group collected secondary data, the group collected storm damaged in 1989 and resulting in 80 meters over salt marsh. About 200,000 tonnes of shingle was moved during the storm 800 meters of the beach was flattered the level o beach was reduced by three meters over night, now the group knows why the beach seriously needs to be managed.
The group also found wind, waves, tides, surges, current and weather systems all combined to create force acting on the beach. The shape size material on the beach determines how it wills response to these responses such as complexes systems needs careful research if it is to be managed effectively this tells how the team which looks after Christchurch Bay how they try to maintained the sites
Coastal management sustainability
Secondary data
Barton on sea has the most attention of management than the other 2 sites. Revetments, which are mainly large boulder, have to some extent sustained the coast, how?
This image shows Barton on sea and the revetments and groynes which is circled.
Well, unfortunately some parts of Barton on sea were not protected so therefore in result it eroded in the past 20 years, 30m back. This is another concern on why it needs to be protected and how it is protected. Because Christchurch bay is a tourist attraction there is high pressure on authority to improve protection and preserve the cliffs.
This image show the part of Barton on sea which was not protected, so it was eroded 30m back.
Evaluation
This topic was quite good to study, but if I understood it even more in the beginning it would have been even better to study.
Most of the aims of this coursework were met but I can’t say confidentially that they were not able to a high standard. The methods were appropriate as they were easy to understand. The visited sites was huge advantage for me because it abled to see what the coast had been facing there is a disadvantage but did not collect enough secondary data, which is why I had to do my own research this was an extremely tough and time consuming and the data collected was not accurate enough for me from my point of view . I think I have completed this coursework to an average standard. The study could have been improved by more time and better weather there at the fieldwork,
Resources which were used
- Museum at Christchurch bay
- Primary data recorded at the visit
-
Web site used:
- Text books for basic theory
- Slough Library
- Slough & Eton Church of England School Library
- GCSE Bitesize Revision (foundation)
- Photo’s taken on the day