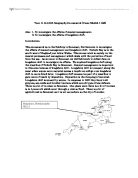
ROCK
However, where there is soft rock there will be a fast rate of erosion, which will form sloping bays. The bay is normally formed when a previous cliff has collapsed. The diagram below shows the different features of costal erosion and bays -
Features of Deposition
Two main landforms created from deposition are beaches and splits.
Beaches are formed where waves have transported and deposited eroded material from the sea. This can be on a wave cut platforms or in bays. Whether the beach is sand or pebble will depend on the rock type and wave energy. This factor also determines the size of the beach.
Facets
The number of facets that are based on the coast depends on the amount of material and pebbles that are on the beach. The facets are how many levels of pebbles the area of the coast has built up by waves that deposit material such as rocks and pebbles on the area. A diagram of the facets at Gore Point is shown on the next page -
Hypothesis
Size of the beach
I predict that the size of the beach will grow as you move further east. This is because long shore drift will carry stones and pebbles down the beach. This means that there will be more pebbles at Hulstone Point than Gore Point because the pebbles move down the beach towards Hulstone Point. This type of bay is called a discordant bay.
Shape of the Pebbles
I predict that the shape of the pebbles should be smoother and rounder in the east. Pebbles at Hulstone Point have the roundest and smoothest pebbles because the pebbles will slowly move down the beach. This will happen because the pebbles will be eroded, as fragments will break as the pebbles move further east. I think there will be very angular pebbles at Gore Point.
Size of the pebbles
I predict that the size of the pebbles will be smallest on the east side of the bay. The pebbles will be smallest at Hulstone Point because as the pebbles are being moved down the beach the pebbles are constantly being smashed against each other. This means that at Hulstone Point the pebbles should be smaller. This process is called attrition
Number of facets
I predict that there will be more facets at Hulstone Point. I think this is because of long shore drift. Long shore drift will build up the pebbles on Hulstone Point. This will also reduce the number of pebbles that are located at Gore Point because they are deposited from Gore Point to Hulstone Point.
Methodology
Measuring the facets
Our first action, we done to go to Gore Point. We went to Gore Point and Hulstone Point because at these headlands we will measure the number, gradient and length of the facets. We will also carry out a investigation determining the shape of the pebble at Gore Point ad Hulstone Point. When we reached Gore Point, we first measured the amount of facets and then we measured the gradient of the facets. Facets are ridges that are created during high tides and stormy conditions. The facets are separated; the material that is deposited on the beach is sorted by the wave energy. To measure how long the facets were, we used a tape measure. We measured the facets to find out what the area and cross-section of the beach area. To measure the gradient of the facets I used a clinometer. The clinometer calculated the angle by looking up from the bottom of the facet and measuring the angle.
We then measured the facets angle of gradient. We measured the gradient of the facets at Gore Point because it showed us how the beach profile affected the way costal processes are acting on Gore Point and Hulstone Point. We first set the clinometer to 0 . I then stood at point A this meant I was looking down to point B. On the clinometer, this showed how much the gradient was. We then continued all the tasks above at Hulstone Point. A diagram of how we measures the gradient of the facets is shown below -
A
B
Measuring the pebbles
After this was done, we calculated the size and shape of pebbles that were at Gore Point. To do this we used our tape measure. We first measured 30 metres starting five metres from the edge of the coast. When this was done, We measured the pebbles using systematic sampling. This meant we picked one pebble every meter along the tape measure and noted down its size and shape. This meant we measured 30 pebbles altogether at Gore Point. We then measured the length (A-Axis) of the pebble using a pebbleometer. To measure the pebbles we calculated the length by placing the pebble in between the two slabs and taking the appropriate measurement. After, completing this we used the powers index to measure the shape of the pebble. We then competed this task for the next 30 pebbles that lied on each meter of the tape measure. The diagram below shows the pebbleometer and where the pebble is placed to measure the pebble. A diagram of the pebbleometer that we used is shown below-
Pebble
When we finished this, we travelled to Hulstone Point where we also measured the gradient of the facets.
The next task we done at Gore Point were to measure 30 pebbles sizes. We done this by setting a 30-meter tape measure and then we calculated each pebble that was at every meter on the tape. For each of these pebbles we measured the length (A-Axis). We then used the powers index to justify the rough shape of the pebble that we examined. We did this by observing each pebble and choosing which shape was correct to the description. We then travelled to Hulstone Point and then carried out the above tasks. The different descriptions are shown below -
Very Angular - everything about the pebble is sharp
Angular - most of the pebble is sharp, except for one or two rounded corners.
Sub Angular - most of the pebble is smooth and rounded with one or two sharp corners.
Sub rounded - few bumps but mostly round and smooth
Rounded - mostly smooth and round with one or two bumps
Very Rounded - very smooth with no bumps, usually egg shaped.
Equipment List
-Ruler
-Clinometer
-Pencil
-Camera
-Clipboard
-Recording sheet
-Pebble meter
-Tape measure
-Powers index
Safety and risk assessment
To make the trip to Somerset safe and secure we followed a number of precautions -
-We were told to keep away from the edge of the sea. This was because it was dangerous, there was a very strong sea current.
- We were also told to keep away from big cliffs. This was because falling rocks from weak cliffs could fall at any point, which could be dangerous.
- We were told not to throw pebbles, which were on Porlock Bay. This is dangerous because the stones could hit someone and they could be seriously injured.
- We were also told to wear protective clothing according to the weather conditions. If the conditions were wet, we needed Wellington boots and a overall waterproof coat. The boots were also necessary because of the unstable nature of the pebbles at Porlock bay.
- If we had any medical condition we were supposed to put the medication in the right pocket of our coat. This was so the teacher could have easy access to the medication we may be carrying.
- To avoid injuries, we were told to keep in small groups of 3-4. This also helped because we needed four people for the various tasks on examining the different pebbles at Gore Point and Hulstone Point.
Data Representing
Gore Point
Facet 1 - Length - 12.96 metres - Gradient +4
Facet 2 - Length - 4.18 metres - Gradient -13
Facet 3 - Length - 4.35 metres - Gradient -5
Facet 4 - Length - 4.75 metres - Gradient -15
Facet 5 - Length - 5.42 metres - Gradient -19
Facet 6 - Length - 7.48 metres - Gradient -8
Pebble
Data Representing
Hulstone Point
Facet 1 - Length - 13.3 metres - Gradient +4
Facet 2 - Length - 17.8 metres - Gradient -5.8
Facet 3 - Length - 11.7 metres - Gradient -15
Facet 4 - Length - 6.3 metres - Gradient -20
Facet 5 - Length - 3.3 metres - Gradient -11
Facet 6 - Length - 3.4 metres - Gradient -4
Facet 7 - Length - 3.9 metres - Gradient -12
Facet 8 - Length - 3.7 metres - Gradient -14
Pebbles
Average length
The average length of the pebbles I examined at Gore Point was 12.5 cm long.
The average length of the pebbles I examined at Hulstone Point was 9.1 cm long.
When I counted the facets, I also measured the size and placement of 30 stones on the pebble shape powers index. A description of the shape and of the stones and their names are listed below -
Very Angular - everything about the pebble is sharp
Angular - most of the pebble is sharp, except for one or two rounded corners.
Sub Angular - most of the pebble is smooth and rounded with one or two sharp corners.
Sub rounded - few bumps but mostly round and smooth
Rounded - mostly smooth and round with one or two bumps
Very Rounded - very smooth with no bumps, usually egg shaped.
From completing this task of measuring the length of the pebbles and placing them on the powers index, I found out that most pebbles at Gore Point are mixed and consist of every type of pebble. This not true with the pebbles at Hulstone Point as most pebbles at this point are rounded or very rounded. This shows me that long shore and attrition is talking place as most pebbles are rounded.
A diagram of the sheet showing the powers index. The powers index was used to distinguish the shape of the pebble. The sheet is shown below-
A clarification of the difference in the shapes and sizes of the pebbles is shown below-
Hulstone Point
This shows me that the pebbles were smooth and small compared to the pebbles of Gore Point. An example of the pebbles at Gore Point is shown below -
Gore Point
This shows me that the rocks are ‘very angular’ and most pebbles are very big compared to the pebbles of Hulstone Point.
Data Charts and Graphs
Gore Point
This chart and graph shows the pebble distribution between a section of the pebbles that were examined -
The total number of pebbles examined was 30 pebbles.
Hulstone Point
This chart and graph shows the pebble distribution between a section of the pebbles that were examined -
The total number of pebbles examined was 30 pebbles.
To extend the investigation I worked out the mean length of the rocks and the angle of the pebbles, the results of which are as follows -
The average mean pebble at Gore Point is 13.5 cm long
The average mean pebble at Hulstone Point is 9.2 cm long
The range of pebbles for Gore Point was between 25.5 - 4.5 centimetres. This is a range for Gore Point of 21 centimetres.
The range of pebbles for Hulstone Point was between 10.2 - 4.1 centimetres. This is a range for Hulstone Point of 6.1 centimetres.
Hulstone Point and Gore Point
The graph below different types of pebbles and how many where the pebbles are based. This could be at Gore Point or Hulstone Point -
The total number of pebbles shown in the graph is 60 pebbles.
Gore Point results are in dark grey, Hulstone Point results are in light grey
Class results
Gore Point results are in dark grey, Hulstone Point results are in light grey.
Pebble length
Gore Point
The table below shows the length of the pebbles we examined at Gore Point. The graph is split into 2.4 cm gaps.
The graph below shows the frequency of the number of pebbles that were at Gore Point.
Hulstone Point
The table and graph below shows the length of the pebbles we examined at Hulstone Point. The graph is split into 2.4 cm gaps -
The graph below shows the frequency of the number of pebbles that were at Gore Point. It shows the range of sizes -
Hulstone Point and Gore Point
The table and graph below shows the length of the pebbles we examined at Hulstone Point and Gore Point. The graph is split into 2.4 cm gaps -
The graph below shows the frequency of the number of pebbles that were at Gore Point. It shows the range of sizes
Beach Profile
The two diagrams below show me the different cross-section of the beach. The beach profile shows me that Hulstone Point beach is much larger compared to Gore Point beach. The lengths and gradients of the facets is shown below -
Gore Point
Facet 1 - Length - 12.96 metres - Gradient +4
Facet 2 - Length - 4.18 metres - Gradient -13
Facet 3 - Length - 4.35 metres - Gradient -5
Facet 4 - Length - 4.75 metres - Gradient -15
Facet 5 - Length - 5.42 metres - Gradient -19
Facet 6 - Length - 7.48 metres - Gradient -8
The average length of the facets for Gore Point is 6.93 metres
The beach profile for Hulstone Point is much larger compared to the beach at Gore Point. The lengths and gradients of Hulstone Point is shown below -
Hulstone Point
Facet 1 - Length - 13.3 metres - Gradient +4
Facet 2 - Length - 17.8 metres - Gradient -5.8
Facet 3 - Length - 11.7 metres - Gradient -15
Facet 4 - Length - 6.3 metres - Gradient -20
Facet 5 - Length - 3.3 metres - Gradient -11
Facet 6 - Length - 3.4 metres - Gradient -4
Facet 7 - Length - 3.9 metres - Gradient -12
Facet 8 - Length - 3.7 metres - Gradient -14
The average length of the facets for Hulstone Point is 7.93 metres long.
To measure the beach profile I used the length and gradient of the facets that I calculated. I measured the beach profile using a 1cm of paper = 2 meter of land.
The beach profiles for Gore Point and Hulstone Point is shown on the next page -
Data Analysis and Discussion
In this section, I will use the data collected to explain the costal processes on Porlock Bay.
Section 1 Facets + Beach
Lengths of Facets
The graphs and tables showing the facets of the bay reveal the extent of long shore drift taking place at this bay. The first facet from Gore Point and Hulstone Point both have rising, positive gradients. This is always true for the first facet of any coastline because there is always a big ridge of material at the top of a coastline, normally due to stormy conditions when very big destructive waves forced material up to the top of the coastline.
The lengths of the facets at Hulstone Point show me that the facets are longer at Hulstone Point. The average length of the facets at Gore Point is 6.54 metres long. However, the length of facet at Hulstone Point is 7.93 metres long. This shows me that the facets are bigger at Hulstone Point because of Long Shore drift. Long shore drift will transport the pebbles to Hulstone Point from Gore Point, which will build up the facets at Hulstone Point.
Beach Profile
The beach profile for Gore Point that the facets are almost placed in an odd order, which sees the gradient fall rapidly and then ease off at the next facet. The facets at Gore Point have a very long facet, which is caused by material being deposited at this point over a long time.
However, the beach profile at Hulstone Point showed me the facets at Hulstone Point are longer at the beginning but the trend at the end shows that the facets grow smaller as I move nearer to the edge of the sea. The beach profile for Hulstone Point is much larger this may be due to long shore drift transporting the pebbles from Gore Point to Hulstone Point.
Overall, the beach profile shows me that the cross-section area of Hulstone Point is bigger than of Gore Point. This should also mean that there would be more pebbles at Hulstone Point because the area is bigger. The cross-section area of Hulstone Point is almost 2x as big as Gore Point. I think this is because Long Shore Drift building up the facets and the pebbles at Hulstone Point.
Number of Facets
The number of facets also differs between Gore and Hulstone Point. At Gore Point, we measured six facets and at Gore Point, we counted eight facets. This shows that there is more material based at Hulstone Point than Gore Point. I think this is because of long shore drift taking place at Porlock Bay.
Section 2 Pebbles
Pebble Size
The 30 pebbles that I measured showed me instantly that the pebbles at Hulstone Point are smaller than the pebbles at Gore Point. This was also shown when I calculated the averages of the lengths of pebbles at Gore and Hulstone Point. The average pebble size for Gore Point was 12.5 centimetres long. The average pebble size for Hulstone Point was 9.1 centimetres long. These averages showed me that the average pebble was bigger at Gore Point. This also shows that attrition is breaking fragments of pebbles. This is whilst long shore drift is transporting the pebbles from Gore Point to Hulstone Point. To tell that these pebbles have been situated at Gore Point or Hulstone Point for a long time, we can see if liken has built up on the pebbles that we examined.
The graph for the size intervals at Gore Point shows me that the pebbles are evenly distributed around Gore Point. This is only to exception from 0-2.4 centre metres. The pebbles are distributed evenly around Gore Point because abrasion is always breaking up the rocks to form smaller rocks. Hydraulic action is also forming new rocks and pebbles because hydraulic action is always breaking down the cliffs to form more pebbles of angular shapes.
The graph for the size intervals at Hulstone Point shows me very different results to Gore Point because most pebbles are of 5.0- 7.4 centimetres in size. If the pebbles were not of this size, most other pebbles would be of 2.4 - 4.9 centimetres in size. I think most pebbles are of this size because long shore drift have all transported the pebbles from Gore Point to Hulstone point. Abrasion and attrition have broken down the pebbles to this smaller size as well as making the pebbles rounder.
Average pebble size
The average pebble sizes showed me that the average pebble at Gore Point is bigger than at Hulstone Point. This shows me that attrition has broken the rock fragments to make it smoother, rounder and smaller at Hulstone Point, whilst the pebble is carried by long shore drift.
Range of Pebbles
The pebbles I collected also showed that there is a wide range of pebble sizes at Gore Point. The range of the results also showed me there is not a very wide range of pebble sizes. The range of pebbles for Gore Point was between 25.5 - 4.5 centimetres. This is a range for Gore Point of 21 centimetres. The range of pebbles for Hulstone Point was between 10.2 - 4.1 centimetres. This is a range for Hulstone Point of 6.1 centimetres. This showed me that there is a big difference between the biggest and smallest pebble at Gore Point. This also proved that the process of attrition and transportation is breaking up the pebbles to make them smaller at Hulstone Point.
Section 3 Distribution of pebbles
Pebble Shape Distribution
The next part of my investigation was to determine how the pebbles are distributed at Gore Point. The chart showing the pebble shape distribution of Gore Point showed me that most rocks at Gore point are sub-rounded. This shows that the pebbles that we measured were very averagely shaped. However, I believe that if I had investigated further I would have reached a different result as the pebbles are by theory supposed to be angular shaped.
The graph showing the pebble distribution at Hulstone Point shows me that that the main types of pebbles at Hulstone Point are either very rounded or rounded. The theory was correct as attrition breaks down the rock fragments makes the pebbles smooth. The graph also showed that there are no pebbles that would be classified as very angular or sub angular.
The next graph I analysed was the graph showing both the distributions from Gore Point and Hulstone Point. From the graph, it shows that the majority of pebbles are rounded and very round pebbles are based at Hulstone Point. I can also see that the majority of angular and very angular pebbles are based at Gore Point. However, I can also see that at least five pebbles of rounded and very rounded are located at Gore Point.
The distribution of pebbles
The pie chart for Gore point showed me that the pebbles were averagely distributed. However, overall the pie chart shows me that most pebbles that are at Gore Point are Sub Rounded. This is then closely followed by Angular and Very angular pebbles. However, overall the graph shows me that the pebbles are evenly distributed at Gore Point.
The pie chart for Hulstone Point showed me very different results from the pie chart for Gore Point. The pie chart showed me that the majority of pebbles were Very Rounded and Rounded. This was very different from Gore Point because the pie chart shows that the shapes of the pebbles are not evenly distributed.
To prove that Hydraulic action is talking place. I can see that at Gore Point some of the pebbles are angular and sub-angular in shape. This shows me that abrasion and hydraulic action is breaking down the cliff to form very angular pebbles. This is not true at Hulstone Point because most of the pebbles are Very rounded or rounded.
Conclusion
I conclude that I have found out that there are costal processors are being performed at Porlock bay.
Hypothesis
In response to the 1st hypothesis of there being more pebbles at Hulstone Point, this prediction was correct. To prove that this prediction was correct I can look at the number of facets that are present at Gore and Hulstone Point. My results reveal that there are more facets at Hulstone Point. There are 6 facets at Gore Point and there are 8 facets at Hulstone Point. This shows that there are more pebbles at Hulstone Point because there is more build up of pebbles.
In response to respond to the 2nd hypothesis of the pebbles being very angular and angular in shape at Gore Point, the prediction that I made was also correct. To prove that this point, I can look at the graph that shows the breakdown between the pebbles shape. The graph clearly shows that there are more ‘very angular’ pebbles and there are more ‘angular’ pebbles at Gore Point compared to those found at Hulstone Point.
To respond to the 3rd hypothesis of the pebbles being small at hulstone point. In my investigation, I found out the average the pebbles are smallest at Hulstone Point. This was due to attrition breaking up the rocks in to small fragments. This is while long shore drift transports the pebbles from Gore Point to Hulstone Point.
To respond to the 4th hypothesis of their being more facets at Hulstone Point. To prove this I know that there are eight facets at Hulstone Point and there are only six facets at Gore Point. This was because there is more material being transported to Hulstone Point. This is due to long shore drift transporting the pebbles up the beach to Hulstone beach.
Evaluation
In my investigation, I could have improved the way I collected the data or how I could have further investigated costal processes at Porlock Bay.
To improve my investigation into costal processes at Porlock Bay I could have used more precise measuring equipment. This could include using a more accurate clinometer, pebbleometer or tape measure. This would have improved my investigation because it would give results that are more accurate. Another way to improve the use of the equipment would be to get trained in the use for the equipment. This was because we were unfamiliar with the equipment, which may give inaccurate results.
To make the investigation even more accurate I could have taken measurements from more than just two points at Porlock bay. If I measured at several more points other than Gore Point and Hulstone Point, the data would give a wider range of results.
To give more accurate results we could have also measured the pebbles and the facets at the same time of day. This would have improved the accuracy of the results because the tide levels would remain the same. This would mean that material would be transported whilst we travelled from Gore Point to Hulstone Point.
If we visited Porlock Bay on more days, it would have improved our results. Our present results only contained one days results, however if we travelled on more days it would give us a wider range of results.
To make the investigation more accurate we could have examined more pebbles. This would have increased the accuracy of the results because the odd results and pebbles would be wiped out. This would help my investigation because there would be a greater band of results to examine, and make conclusions on.
The time of year also affected my investigation. As we visited Porlock Bay in the summer. The winds would be ideally slow and the sun shining. However , if we visited Porlock Bay in the winter, the winds would be very strong and it may be raining. When we visited Porlock Bay, the conditions were very windy. This means that there would be more waves and there would be more transportation during the day.
Bibliography
For this report, I used various sources of information. I used the following to help me prepare this report.
Text Books
GCSE Geography – Written by Alain Anderton, Second Edition
Various other reports written by other students helped plan my report.
GCSE Bitesize Geography revision guide, written by David Smith
People
Shila Tailor - this person helped me with this report.
Mr Millar - my geography teacher
Mr Twitchit - this teacher helped me with this report
Electronic
Electronic services also helped me with my report. This included the use of the internet. The websites used to get the information included: -
www.geosites.co.uk/bealgeography
www.Geography.com/coasts
www.georesources.com
www.Geo-world.co.uk
In this report, I also used e-mail to help with my project.
And of course www.corseworkbank.co.uk
Deepak Tailor
11GS
Beal High School