It was during this period that the effect of solar radiation on the readings produced was discovered by the famous inventor; Robert Louis Stevenson. Stevenson developed a way of protecting the thermometers by housing them in small white boxes, mounted on posts above the ground, which are now known in Briton today as ‘Stephenson Screens’ (Strangeways, 1995).
At a similar time to the invention of the thermometer, both barometers (to measure atmospheric pressure) and rain gauges were developed. A significant fault which was not successfully remedied until the advent of computerised data collection was the inability of the barometers to produce ‘continuous data’ (McIlveen, 1992).
During the peak of the British Empire under Queen Victoria, the first large-scale communications of weather and climate data were developed; an example of such was the installation of cables between Britain and India. (Strangeways, 1995).
More simple weather recording instruments such as wind vanes have been in existence for hundreds of years, there importance however did not become apparent until the monitoring of weather patterns and systems and the first widespread classification of wind strength, the ‘Beaufort Scale’.
The atmosphere in which climate systems exist is three-dimensional. To enable the accurate monitoring of such systems, pattern of temperature, pressure, relative humidity and wind, need to be monitored on a similar three-dimensional scale (Day 1966).
Another major development in the recording and monitoring of the weather solved the problem of requiring humans to take the measurements. From the early 20th century, the replacement of humans at the site of measurement began with the introduction of automated recording.
Morse code was initially used to transfer data in France in 1863, with Britain soon utilising the technology. The network has now expanded to cover the entire world and is regulated by the World Meteorological Organisation (WMO).
Communication of data in Europe initially developed in France, links developed in Britain with the formation of the British Rainfall Network (McIllveen, 1992). Linking of data from many sites across the country could then produce a ‘weather picture’.
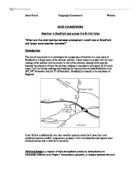
Before the 19th century, the Rainfall Network in Britain consisted of approximately 40 rain gauges. Such a number are now common in a single county. Such data (as shown on the enclosed graph paper for Leicestershire) can be converted from ‘cartographic format’ to ‘grid format’ (Craddock, 1995).
Developments in technology have led to more accurate readings of weather data as well as the speed of production.
In the case of barometers for example, a lighter and more durable ‘Precision Aneroid’ barometer and ‘Aneroid Barograph’ were developed, and were used to record pressure ‘tendencies’.
Further developments included the standardisation of the design and size of the rain gauge. The collection funnel measures 127mm in diameter, mounted on a cylinder, which is situated 305mm above the ground level (Thomas et al, 2000).
In the early 20th century, aeroplanes known as ‘APOBS’ were used to monitor the upper atmosphere. These were then replaced by ‘Radiosonde Observations’ (or RAOBS) in 1937. The use of a radio transmitter allowed almost instantaneous recording of data transmitted from the balloon on which the transmitter was mounted.
A more advanced and higher altitude system was employed in 1960. The launching of the first meteorological satellite provided hydrological data for the WMO (McIlveen 1992).
Such a radar system, used to monitor precipitation and clouds was described by Gossard et al in 1983 as the most useful man made remote sensor for atmospheric observations since World War Two.
Most weather observing stations today are a far reach from the aforementioned early examples with the introduction of fully Automatic Weather Stations (AWS).
AWS’ require no human intervention except to analyse the results produced. Such systems range from inexpensive small-scale examples, which can be owned by education centres and enthusiasts alike to large national-scale complex and expensive examples.
In conclusion there have been many important developments that have changed the face of the weather observations and recordings. Particularly, these include the initial developments of the thermometer and barometer, the monitoring of activities with in the upper atmosphere (including the conversion to the use of satellites) and the networking of weather stations to produce a large scale ‘picture’ of the weather.
Not only can data be recorded the instant it is observed, but the current status in Britain is such that long-term patterns and climate statistics can be derived from sources across the world producing a more accurate and useful resource of data.
References
Atkinson, B.W., (2000) Weather in Thomas, D. & Goudie, A., (2000) Eds, The Dictionary of Physical Geography – 3rd Edition. Blackwell, Oxford.
Craddock, J.M., (1995) Long-range weather forecasting from 1947 onwards, Weather, Vol.50 pp403-405.
Day, J.A., (1966) The Science of Weather, Addison-Wesley, London, pp202-203.
Gossard, E.E. and Strauch, R.G., (1983) Radar Observation of Clear Air and Clouds, Elsevier, Oxford pp1-3.
McIlveen, (1992), Fundamentals of weather and climate, Ch2: Observations
Strangeways, I.C., (1995) Back to Basics: The Met Enclosure- Part1: Its Background, Weather, Vol.50 pp182-190
Thomas, D. & Goudie, A., (2000) (Eds) The Dictionary of Physical Geography – 3rd Edition. Blackwell, Oxford.
Word Count: 824 (excluding references)