Apparatus;
- Tile
- Stopwatch
- Protractor
- Beaker of syrup
- Spatula
- An Adjustable prop
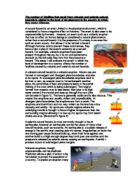
I will set up my apparatus as shown above I will draw a line 2cm on to the tile and then another line 3 cm on from that. I will measure the time taken to travel that distance. I will then adjust the slope and start again. I will only change the angel of the slope. I will take a large range of results from my experiment. I will do the experiment at 5 different measurements between 20° and 70° this will give me 5 different results I will also repeat the experiments 5 times and taken an average of the results. I will make my experiment safe by following all the usual safety precautions that should be taken in a lab such as; no running, no eating or drinking. I will also not sit down whilst doing the experiment so that the syrup does not go in to my eye, I will also remember to clean up any syrup that I may spill.
I will make sure that my results are accurate and reliable by using a large range of results and repeat them to make sure there reliable.
I will make it a fair test by repeating my experiment and by collecting a wide range of results. I will also only change one variable this will make sure that all sets is reliable that one experiment has not had an advantage of another.
From my preliminary experiment I got a tile and set it at 10º and then at 20º angles between 10º and 100º I found out that this was not very good as I found out that at 100º it fell straight off the tile and at 10º it hardly moved. I then decided to start at 20º as this seemed the next logical point to start from I found this worked very well. I then set about solving the problem of when to have my intervals and how many intervals I should have. So I did a series of experiments to see what where the best angles to investigate I tried moving it 2º this did not have much affect so I tried 5º this was not much better so I chose 10º this seemed to work very well. I decided that the highest angle I would do would be 70º then there would be a good range of results. I found out that I must have a large range of results that have been repeated to get an average from the results by doing this I can represent the data in a reliable and accurate way.
Results
Analysis
My results show that the higher the angle of the slope the faster the lava flows down it.
My graph shows that it speeds up before starting to level off.
I conclude that the steeper the slope the faster the syrup will flow down it. I have come o this conclusion from my results table and my graph. My conclusion supports my prediction of the higher the angle of the slope the more GPE will be acting on the lava so the more kinetic energy is produced making it move faster. This means that my scientific knowledge was correct as my prediction and my conclusion match each other.
Evaluation
My experiment that I carried out worked very well I think this because my results seemed to be a very good and accurate. My experiment was also a very safe experiment because I had no problems. This is mainly because I followed the safety procedures I outlined at the beginning of my coursework. I think that I ended up with a very good set of results with no anomalies I think that I got no anomalies because I did my experiment very accurately and carefully because I followed the procedures I outlined at the start of my coursework.
My overall procedure worked very well because I did every thing very accurately. I think because I did everything accurately I got a good reliable set of results. They seemed very reliable as they all seemed to follow the same trend. I think they support my prediction and my conclusion very well. In the future I could investigate all the other variables and see if they all support one another. I would do this by doing all the experiments, compiling all the results in a table and then show them in different graphics to support my claims. I had just enough results to support my conclusion in the future I would collate more results so that I could get a more accurate and fair set of results.