RandInt (1,8)
Result: 5
Location 5 eliminated
87-12=75
Year 2
6,7,2,6,6,1,5,7,1,8,5,4,4,5,8,2,5,7,4,5,3,3,2,7,6,6,1,2,3,3,3,7,1,3,3,6,3,6,5,2,4,5,5,2,2,3,1,8,5,6,3,8,6,5,5,8,2,7,3,1,4,4,7,5,8,1
RandInt(1,8)
Result: 1
Location 1 eliminated
75-7=68
Year 3
3,8,6,8,6,3,1,8,3,5,8,8,7,8,2,5,2,4,2,2,5,6,7,4,8,4,6,4,2,8,7,1,1,7,3,6,8,8,5,2,6,5,3,7,2,2,2,4,4,1,1,6,3,4,8,2,5,2,1,2,1,1,4,7,1,8,1,2
RandInt(1,8)
Result: 4
Location 4 Eliminated
68-8=60
Year 4
2,5,1,5,7,7,6,6,6,8,1,1,4,5,7,2,7,4,3,7,3,7,1,8,7,4,6,1,7,1,2,4,4,4,3,3,4,4,1,6,6,2,8,1,8,2,5,5,2,1,7,6,4,8,2,4,2,7,5,7
RandInt (1,8)
Result: 7
Location 7 eliminated
60-11=49
Year 5
4,6,2,6,6,6,6,1,4,7,4,4,2,1,8,4,4,5,6,6,1,3,4,7,5,5,6,3,6,6,3,6,8,6,8,3,5,2,7,1,7,6,3,2,7,4,2,3,5
RandInt (1,8)
Result: 4
49-8=41
Year 6
7,8,2,4,8,6,2,2,2,3,5,7,2,3,2,7,7,8,5,6,3,1,5,4,8,4,8,6,4,4,1,4,1,8,5,7,3,1,6,1,7
RandInt(1,8)
Result: 5
41-4=37
Year 7
2,2,4,7,5,4,7,6,3,2,8,4,7,2,8,1,3,8,3,3,5,3,5,8,3,6,3,3,4,8,1,2,4,4,1,3,2
RandInt (1,8)
Result: 4
37-6= 31
Year 8
6,1,7,1,8,4,4,1,6,5,1,6,8,4,3,5,6,3,5,2,1,8,1,1,2,6,4,3,3,6,5
RandInt(1,8)
Result: 6
31-6=25
Year 9
3,6,6,2,2,2,7,1,4,7,7,8,4,2,5,1,6,2,1,4,5,2,1,2,2
RandInt (1,8)
Result: 8
25-1=24
Year 10
6,8,5,1,6,7,2,8,4,1,8,7,5,8,2,5,7,8,7,4,7,4,3,2
RandInt(1,8)
Result: 7
24-5=19
Year 11
5,4,2,1,3,3,7,2,8,4,5,6,1,2,6,5,6,6,4
RandInt(1,8)
Result: 8
19-1=18
Year 12
3,7,8,4,7,4,1,2,7,1,3,6,3,8,1,6,3,8
RandInt(1,8)
Result: 1
18-3=15
Year 13
7,4,5,8,7,5,7,3,4,4,7,3,3,4,1
RandInt(1,8)
Result: 5
15-2=13
Year 14
1,4,3,3,3,1,5,4,3,8,6,7,3
RandInt(1,8)
Result: 1
13-2=11
Year 15
7,6,4,5,5,4,8,2,3,5,7
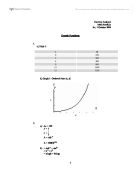
The graph would be:
y= (1/2)^x
Y=102.2436
When y=5, x will be 20.36568998
Where the line is the original formula and the dots are my prediction. We can see that they are more or less similar.
The appropriate model for this will be Exponential Regression (ExpReg). We can see that it is not a linear, r cubic regression. So, according to the model we can see that the population will reach 5 in 20 years.
In year 4, it will reach its first half life (49), in year 8 it will reach its second half-life (25) and in year 15 it will reach its third half-life (11).
By finding the average, (4+4+7):2=5. Thus, the half life will be 5 years. This might not be accurate because there are rounding offs.
The limitations will be:
- In this case, we assume that once the place is cleared, the will be other animals occupying the space. But when animals feel there is a danger, they won’t settle there.
- We use RANDOM NUMBERS, which allows us to reuse the number that we used already in the data. This might give less accurate results.
- We can see no Growth. Is it possible only to have decaying process without any growth?
- The attack of predators which in this case happens annually, but in the real world the animals may attack more than once a year.
Q3) The concept: The concept is limited to decay without growth.
The assumptions made will be
- The population has no other option that those 8 places provided
- Members are not going out from that 8 location
- There’s no regular predator attack.
The limitations will be more or less similar to the limitations of the previous model. With these calculations and graphs, we have proven that the random allocation of population and it’s predator’s attack results in half life graph ( exponentially decaying graph)