This final site was found at a place called “The Carrs” and so is referred to as “Site 3, The Carrs”.
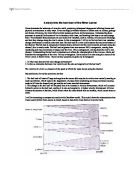
When the data has been collected, it will be put into tables and graphs. I will compare results from site to site, e.g. does the wetted perimeter increase as we travel down, and do the rocks in the bed load become more rounded, as stated in my hypotheses.
Chapter II, Data Collection
Our tests
Once we had chosen our spot to collect from, we worked in groups of three to gather information, such as:
The width of channel from bank to bank (we used a tape measure which one person held on one bank and the other person drew across to the opposite side.)
The Depth, (Using the distance from bank to bank, we divided the stream into twelve measurements of depth at even distances into the river, this enabled us to work out an average depth, which could then in turn be used to measure the cross sectional area.)
(We measured this with either a meter ruler or a large measuring pole for deeper water. When using a meter rule, we had to make sure the broadest sides of the ruler were not blocking the full flow of the river, as this would affect the results by making water rise up the ruler due to the resistance to the flow.)
The wetted perimeter, (which we measured using a small chain which was lain along the bottom of the stream all the way across then measured to tell the total perimeter of the stream with all the abnormalities in shape)
The roundness, angularity and size of the rocks found on the river bed (This was measured using the Powers roundness chart; also we measured the height length and depth of the stones, we took 10 random samples at each site.)
The Velocity, (This was measured using a cork and a timer since we did not have access to a flow meter. We released the cork into the stream and timed how long it took to travel an allotted distance down stream)
The Depth, (Using the distance from bank to bank, we divided the stream into twelve measurements of depth at even distances into the river, this enabled us to work out an average depth, which could then in turn be used to measure the cross sectional area.)
Take digital photographs, Our teacher used a digital camera to take pictures of each site we visited.
Equipment used
- Waterproof clothing and suitable footwear
- 2 Water depth ranging poles
- Clip board with measuring boards, set with graph paper, vertical and horizontal rulers as well as a copy of the powers roundness index
- Metre ruler
- Cork and stop watch for velocity
- Pencils and pens
- Clinometer to measure inclination (slope/gradient)
Site 1, Macclesfield Forest
After driving for a long time uphill through narrow old roads and villages, we passed reservoirs and lakes as we made our ascent to the forest.
At 10:50am, we arrived at a small parking area next to an old dry stone wall, from where it was just a short walk over a bridge and to “Site 1, Macclesfield Forest”.
This was a very good example of a river source.
Little more than a mountain stream slowly wound it’s way downhill into a small river channel the stream had eroded away, it form the characteristic v shaped valley in the hills, this is due to the water travelling fast down hill through the most efficient route possible, eroding the sides of the two hills it travels between.
The gully was lined with algae and vegetation high up the sides. This implies
That at some times in the year the water level would be much higher than it was on our visit. The area was likely to receive a lot of relief rainfall which occurs when warm air masses are forced upwards to rise over an obstacle (When air masses reach
higher land, the air is forced up and over the obstacle, as the air travels upwards, it is
required to loose mass, it achieves this by shedding excess water as rain)
The water was very shallow, fast moving, and the rocks found on the riverbed were large, angular stones, with jagged edges. The weather was wet, with dark clouds and grey sky as well as light drizzle, also there was a small amount of flying insects found here, but not many as they are a characteristic of Stagnant, or slow moving water.
Site 2, Langley
Site two was further down hill, found at a place called “Langley”. We arrived at Langley around 12:50am and headed off to the river, which was now larger water course due to input from many tributaries, there were many Confluences (the joining of one or more tributaries to form a single larger stream) along its course.
Its course was less winding and it ran almost level with the brick buildings found on its left until it changed course and turned left downstream. To the right there was a large field.
The river was on less of an incline and was slower moving, it also had a much larger width and a greater depth, the rocks found on its bed were less angular, more rounded and smaller than at the Macclesfield Forest.
By this time the weather had improved, the sun was shining and the temperature was increasing. The air above the water at this site was teeming with biting insects
Such as midges, which implies that there was stagnant water near by?
Site 3, the Carrs
The final site was a large river in a large area of flat land named “The Carrs”. It was measured as the deepest of the three sites, and could submerge a person up to their waist, its bed was sandy, and its sides where cliffed. We had chosen this site as a great example of a Meander, a typical characteristic of the lower course of a river.
Most of the stones found here where small and rounded, though some larger rocks had been moved by the great weight of water. There was a large amount of reeds and water vegetation found in the river. The weather at the Carrs was good, the sun was shining brightly and had heated up the air, there was little wind, and the water felt physically warmer.
After collecting all the information, we began the long journey home. When we returned home we had the large task of compiling the data to structure the coursework you see before you.
Chapter III, Data Presentation
Site one Macclesfield forest
Mean Volume of bed load (total/10) = 28.9cm³
Mode Roundness classification (most occurring number) = 1
Velocity of flow = site 1-0.21m/s
Gradient of site one: 3 degrees downstream
Here is a pie chart showing the numbers of rocks falling into the “Class Categories”
Of the “Powers roundness index”
Site two “Langley”
Mean Volume of bed load=303.89cm³
Mode Roundness classification=3
Velocity of flow =0.22m/s,
Gradient of site two: 1 degree downstream
Here is a pie chart showing the numbers of rocks falling into the “Class Categories”
Of the “Powers roundness index”
Site three, The Carrs
Mean Volume of bed load= 66.9766cm³
Mode Roundness classification = 4
Velocity of flow = 0.26m/s
Gradient at site three: 0.86 degrees downstream
Here is a pie chart showing the numbers of rocks falling into the “Class Categories”
of the “Powers roundness index”
Chapter IV, Data interpretation
The decrease in gradient tells me that as we go down, the water is at less of an angle, this means that the water has less pull from gravity on its way down.
The increase in velocity tells me that though there is a decrease in gradient that the reduced restriction and the more efficient river system speeds up the movement of water.
The change in angularity leads me to believe that due to attrition, erosion and suspension, much of the angular rock from site one is broken down and transported as solute or deposited as sand.
The increase in width of the channel in which the water flows tells me that as more water joins the flow at tributaries, the extra weight adds extra power to the flow, meaning erosion occurs more strongly, wearing away at the sides.
Due to the bed load increasing, and the mean volume of rock is rising, this implicates that stronger currents can move larger stones along the bed. This will lead to increased attrition as huge boulders crush smaller rocks against the sides of the river.
Chapter V, Conclusions
My hypotheses are:
- The character of the course of the River Bollin will change along its course to the mouth.
- The bed load will decrease and angularity of the materials found in the river will be reduced.
- The velocity and discharge will change along its course downstream.
Hypothesis 1
This hypothesis was correct, as the character of the quaint forest stream first became a larger village passing river, less isolated and therefore with more interference by man. (Though the removal of trees at sight one indicated it was well managed) The final sight was completely different again, and the water was much deeper as it headed off to sea.
Hypothesis 2
My final hypothesis was also proved correct, as the bed load became increasingly more rounded later on in the water course. This occurred because the rocks suspended in the water are eroded by attrition as the rocks and other suspended particles strike the sides of the stream, as well as each other.
Hypothesis
In accordance with my prediction, the water velocity
increased as we travelled downhill, it gained speed. There are a number of reasons for this. The first being that we were not using a flow meter, but instead a cork, which snagged on the rocks that rose above the water.
This meant that regardless of the velocity of the water due to the power of gravity pulling it down hill, the time for it to be pushed over rocks is increased.
At site two and three, not only were there no rocks to restrict the cork, but the increased volume of water added weight to the equation.
With the added weight, the speed also increases as it gives it more potential energy.
When the water reached site three, the efficiency of the river is increased, and with little restriction or obstruction as it has eroded a channel. When the water reaches a meander, the flow is faster on the outside of the bend, where it is slower, despoliation occurs, this forms beaches on the inside of the bend.
As the efficiency of the river increased, the discharge increased, as less water was being blocked off along its course. This was aided by the fact that more water was being forced through the course as more tributaries added to it.
Chapter VI, Evaluation
Though the day was very much a success, there were many ways in which it could have been far improved.
The very biggest limitation was that on the day, our teacher forgot to bring the flow meter. This made it difficult to get an accurate reading of the velocity of the water. Due to our lack of flow meter, we were forced to use a cork and a stop watch to measure how fast the water was travelling. The cork had a tendency to travel slower in the shallower, yet faster moving water of site 1, as it often got caught between stones in the bed.
Later on, with deeper water the cork was not obstructed so travelled faster, regardless of the fact that the water was travelling slower than at site one.
This gives the impression that the water is slower at the top of the mountain, were the incline is steeper.
If we were to re do the experiment, I would use a flow meter.
Another thing is that site 1 was chosen because of its accessibility, a not necessarily a perfect example of a river source. If the investigation was repeated, I would possibly travel further up hill to a faster flowing stream.
Another thing, though difficult to remedy, was the fact that the metal chain used for measuring wetted perimeter was difficult to hold in place in deep water, I would have preferred to have weighed it down at the end.