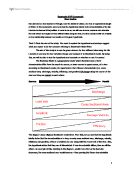
Referring to the outcome of my study, I predict that the given hypothesis will be correct. By observing the model above, we can see that as the river moves from the source to the mouth, each and every characteristic will change, and as one varies, the others will as well because they are interconnected. For example, for the Rio Lizandro, I predict that as the friction decreases as the river moves along its course, the average velocity and efficiency of the river will increase. This change in average velocity will cause the cross sectional area to increase, and so on.
Task 4: Presenting the Results. You have been given data concerning the four sites, now you need to do the calculations and draw the cross-sections.
Site 1: Mata Grande
Distance from source 4km. Gradient: 6º
Velocity measured over 2 metres in the centre of river flow
Average time = 21+11+15 = 47 = 15.7 seconds
3 3
Average velocity: Distance / Time = 2 / 15.7 = 0.13m/sec
Width x Average depth
Average depth: 0+9+7+9+1+3+2+0 = 3.87 = 4cm)
8
159 x 4 = 636cm2
Cross sectional area x Velocity
636 x 0.13 = 82.68 = 83cm 3/ sec
Cross sectional area
Wetted Perimeter
636 / 16.7 = 38cm
Site 2: Cheleiros
Distance from source: 6km. Gradient: 3º.
Velocity measured over 10 metres in the centre of the river:
Average time: 14+17+10 = 41 = 13.7 seconds
3 3
Average velocity: 10 / 13.7 = 0.73m/sec
Width x Average depth
Average depth: 0+8+10+20+28+21+12+0 = 12.4 = 12cm)
8
314 x 12 = 3768cm2
Cross sectional area x Velocity
3768 x 0.73 = 2750.64 = 2751cm 3/ sec
Cross sectional area
Wetted Perimeter
3768 / 16.4 = 229.76 = 230cm
Site 3: Carvalha
Distance from source: 16km. Gradient: 1º.
Velocity measured over 10 metres in the centre of the river flow:
Average time = 10+12+14 = 12
3
Average velocity: 10 / 12 = 0.83m/sec.
Width x Average depth
Average depth: 0+0.32+0.20+0.16+0.16+0.22+0.27+0.38+0.25+0.20+0.13+0.05+0.23+0.25+0.21+0.12+0.07+0.02+0
19
= 0.17m
9 x 0.17 = 1.53m2
Cross sectional area x Velocity
1.53 x 0.83= 1.2852m 3/ sec
Cross sectional area
Wetted Perimeter
1.53 / 9.5 = 0.161 = 0.16m
Site 4: Foz de Lizandro
Gradient: 0º.
Time taken for float to travel 10 metres:
Average time = 35/3 + 32/3 + 40/3 = 11.7 + 10.7 + 13.3 = 35.7 = 11.9
3 3 3
Average velocity: 10 / 11.9 = 0.84m / sec
Width x Average depth
Average depth: 0.15+0.57+1.35+1.51+1.60+1.67+1.00+0.56+0.41 = 0.91
13
11.76 x 0.91 = 10.7m2
Cross sectional area x Velocity
10.7 x 0.83 = 8.881 = 9m 3/ sec
Cross sectional area
Wetted Perimeter
10.7 / 14.25 = 0.754 = 0.75m
Task 6: Analysis & Conclusion (Note: all of the data mentioned below has been purposely converted to cm for more accurate analysis).
By looking at my results and calculations, I can see that the given hypothesis is correct « Stream characteristics (i.e. cross-sectional area, discharge, velocity, efficiency, and gradient) all change along the course of the river and they are related to each other».
When referring to the discharge, which is essentially the amount of water flowing through the river, we can see that it gradually increases from site 1 to site 4. The higher the discharge, the more sediment the river can carry. In site 1 the discharge is calculated to be 83cm3/sec, which then steadily increases 900cm3/sec by the time we reach site 4, which supports Bradshaw’s model river.
Although we did not measure the friction of Rio Lizandro, we can assume that it decreased because the cross sectional area increased. Because of this, we can see that the river will have more energy to erode the sides. The cross sectional area begins with 636cm2, which increases to 3768cm2, further to 15300cm2, and finally to 107016cm2 in site 4. We also did not measure the load size, but we can assume that it decreased not only because of the cross sectional area, but also because the erosion in the river causes the rocks to decelerate as it travels from source to mouth.
Aside from the cross sectional area, we can see that the friction of the river decreases because the hydraulic radius increases. Overall, there is an increase of 7470cm in the hydraulic radius from site 1 to 4, which is considerably high. Due to this, we can see that there is least friction near the mouth of the river, or in site 4, than in the source of the river, or site 1, because in the source the hydraulic radius was 38cm, whilst at the mouth, it was 7508cm.
The decrease in friction shows that the river’s efficiency increases, as these characteristics are inversely proportional. The reason for this is because the river becomes more efficient as it has more energy to undergo erosion as there is less friction.
Referring to the average velocity, we can see that the hypothesis was correct. According to the results, the velocity increased from 0.13m/sec to 0.73m/sec, to 0.83m/sec and finally to 0.84m/sec. Although we can see that the increase in average velocity is shortening, it is still following the hypothesis.
The gradient, which is essentially the angle as which the river travels, not only decreases, but practically halves as the river travels from source to mouth. Looking at the measured gradients, it begins in site 1 with 6º and halves to 3º in site 2. Although half of 3 is 1.5, the gradient of site 3 is 1; and although half of 1 is 0.5, the gradient of site 4 is 0. It is for this reason that the halving pattern cannot be taken into consideration if we were predicting the gradient for other sites in other rivers. Nevertheless, the decrease in gradient along the river supports Bradshaw’s theory.
Essentially, the wetted perimeter means the perimeter of a cross sectional area that is covered with water. Although it is not included in the hypothesis, it however does not show to have any pattern at all. At first, the wetted perimeter shows a decreasing pattern along sites 1 to 2, as it decreases from 16.7 to 16.4 cm. But from sites 2 to 4, the wetted perimeter increases from 16.4cm to 950cm to 1425cm. It may be that the data for site 1 is incorrect and is supposed to be lower, in order to show an increasing pattern for the wetted perimeter from source to mouth.
So, overall as stated in the hypothesis, the stream characteristics do change along the course of the river. It is also correct that they are all interconnected. As you can see from the results, the hypothesis stated in the beginning of the coursework is fully correct and the characteristics of Rio Lizandro meet accordingly with what Bradshaw’s table shows, as seen in the results and calculations. Hence, stream characteristics all change along the course of the river and they are all interconnected in one way or another.