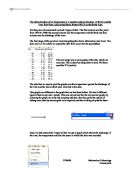
This graph was different to the graph that we had done before. We had 3 different types of data to put into 1 graph. This was carried out like the any normal graph, by selecting the graph we want and selecting add data, this then gives the option of adding more data by selecting the cells required and then clicking ok puts the three
Once we had entered the 3 types of data we got a graph which shows the discharge of the river, the temperature and also the years in which the data was recorded
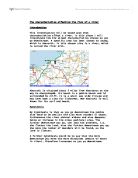
The next stage was to plot just the air temperature against the discharge.
So as before the first step was to select the data which we needed to use (temperature and discharge) once this was done we just as scatter diagram this time to give us a clear picture of the discharge relating to the temperature.
The graph we got is below.
This shows the discharge of the river against the temperature..
The first graph is a graph containing the data of, years, temperature, and discharge of the river.
From the graph, it is clear that the amount of discharge of the river throughout the years has never been the same.
This is down to that the temperature has never been the same, there have been parts of the year in which the temperature has been low compared to the year before or it has been higher that in the past. This is the main contributor to how much discharge there is throughout the years in on the graph.
As can be seen on the graph above, that when the temperature is high then so is the discharge, in 1995 the temperature dropped to 7oC this lead to a decline in the amount of discharge which happened, whereas when there was a higher temperature in 1998 there were higher levels of discharge in the same year.
This is down to the fact that the higher the temperature is then the river is more likely to produce more discharge as this is because the ice melts and forms water, whereas in colder temperatures the fact that the temperature is cold doest affect the ice to much and doesn’t produce as much discharge.
The second graph we carried out was only in relation to the amount of discharge against the temperature.
This graph shows that as the temperature increases the amount of discharge also increases. This is what we expected, because as the temperature increases the sun’s energy melts the ice, this means that more ice turns to water hence meaning that there is more discharge when the temperature is higher whereas the amount of discharge is lower when the temperature is lower.
Overall the findings from this piece of coursework as well as common knowledge is that when there are higher temperatures there is greater discharge, whereas when there is periods of lower temperatures there is less discharge. This can be seen on the graph as there is a positive correlation, this is because as the temperature rises so does the volume of discharge.
11JH 11/06/06 Information Technology