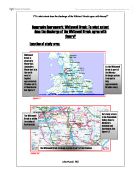
View from Birdlip
We drew a pie chart of the land use at Birdlip. Half of the pie chart was taken up by the fields because majority of the site were fields. With the other half of the pie-cart, I split it into two for buildings and woods. There was a lot of natural scenery and vegetation at Birdlip. There was also a geological section at Birdlip.
Geological Section
At the second site we visited with was Buckholt Woods, the Environmental quality index was rated high due to the lack of buildings being present and no litter to be spotted. It received the total score of 31/35 which was the highest mark from all the six sites we visited. This shows that Buckholt Woods was one of the best sites from the six sites we visited.
Land use at Buckholt woods is mainly filled with woods and vegetation. We spotted a few fields and a small pathway going thought the woods. There was also the source of the river with a stream going through it.
I took the cross-section recording at Buckholt Woods and the width of the river is 80cm and the depth of the river is 3.6cm from the middle.
At Buckholt Wood I also did a bedload analysis and found that the length of the pebbles on the left, middle and the right of the stream were quite long. The pebbles were all mostly angular. The width an the left side of the stream was quite small where as on there middle and right side of the stream the width is 7/6 which is very similar to each other.
I took the bedload grab sample which was taking 10 stones from Buckholt Woods from near the stream and the length was around 10cm and the width was around 7.5cm. Most of the stones were sub-rounded and angular.
I drew a graph on the velocity and my results show that on the left side of the brook the dog biscuit travelled the fastest on that side. It only took 29 seconds for it to travel 10 metres. On the right side of the brook the dog biscuit travelled 10 metres in 53 seconds which is almost double the amount of the time of the left side. In the middle of the brook it took 39 seconds to travel 10 metres. This shows that the brook was moving faster on the left side.
The source of the river was at Buckholt woods. The source was quite narrow.
Source of the river
The third site we visited was Brockworth. I also did an environmental quality index and its total score was 23. The amount of vegetation was high. There were a lot of buildings spotted which was not good. There was not a lot of human impact. The view was also good but the buildings lowered the total score.
The land use at Brockworth was mainly buildings. There were also a lot of fields and gardens. There was also a little section of a stream spotted as well. The main land use consisted of buildings.
The velocity at Brockworth was quite high which shows us that the stream was moving quite slowly because the left, right and the middle side of the stream was around 50 seconds for the dog biscuit to travel 10 metres. The stream had a lot of leaves and twigs which made the velocity test unfair because the leaves and twigs stopped the dog biscuit on its journey of 10 metres.
I also recorded the stream cross-section and I found that 340cm was the width of the stream and the deepest spot was at 100cm width and was 1 metre deep.
I took a bedload grab sample and I found that most of the stone were rounded and the length was around 10cm and the width was 6cm. This shows that the length was quite long.
I also did a bedload analysis at Brockworth and on the left and middle side of the stream the pebbles were around the same size which is 10cm in length. On the right side of the stream, the pebbles length was around 7cm. The width of the pebbles was around the same on the left and middle side of the stream of 5cm. On the right side of the stream the width was around 6cm. Most of the pebbles were angular but on the left side the pebbles were more sub-rounded.
The fourth site we visited was Hucclecote. The environmental quality index had a high mark and the litter and human impact which tell us that there were no traces of litter to be seen. The variety of vegetation was good but not brilliant but there was a lot of it. Hucclecote received the total mark of 27/35.
I took a cross section recording at Hucclecote and I found the depth of the river which was 67cm and the width was 400cm. The above recording of the depth was from the middle of the river at 170cm.
I also did a bedload grab sample and found that most of the stones by the river were sub-rounded and the width of the stones were around 3.5cm and the length was around 5cm.
I took the velocity at Hucclecote and the results indicate to me that the river was flowing quite fast. Overall it took about 30 seconds for the dog biscuit to travel 10 metres. This was the fastest recording from the four sites where velocity was taken place.
The land use at Hucclecote was mainly fields and woods. There were also quite a lot of buildings spotted with roads cutting through the streets. There was also a lot of vegetation in the woods.
The fifth site we visited was at Innsworth and the environmental quality index was very poor. Innsworth received the lowest total score from all six sites. At Innsworth there were a lot of buildings but at the site there was not many variety of vegetation to be seen. We found traces of alcohol in the river and litter such as old bike.
Old bikes and rubbish in Innsworth River
I did a cross section at Innsworth which was hard to do due to the steepness of the slopes near the river. Our group were the only people who took the cross-section. The width of the river went to 150cm and the deepest was 85cm at 140cm.
I also did a bedload analysis and found that most of the pebbles were sub-rounded. My results also show that the width and lengths were very similar, they were around 6cm width and the length was around 10cm.
The land use at Innsworth, 25% of it was filled with grass, another 25% was filled with main land, another 25% was used by buildings and the remaining 25% was divided between the stream and the road. This shows that there were also a lot of buildings at this site. The human impact had the highest score from the other six places.
Human Impact at Innsworth
At the sixth site we visited which was Sandhurst, the environmental quality index the amount of vegetation and the variety of vegetation was rated high however the buildings were given a low mark. There were no traces of litter to be seen.
The land use at Sandhurst consisted mainly of fields. About 25% percent of the land was used for farming and also about 25% consisted of the river.
Methodology
For my methodology I used primary data where I used by collecting questions and answers and observing or measuring things. We also used secondary data such as maps and text books.
We went to six different places to observe the rivers and slopes and each place we did the measuring in different forms.
The first task we did was that we drew sketches of the beautiful scenery surrounding us at the place we went which was Birdlip. The reason why we decided to draw a sketch at Birdlip is because of the amazing view of Gloucester which we could see. The view was very clear and we spotted so many buildings which we were familiar with from the top of Birdlip.
Sketch of view from top of Birdlip
At the first site I also spotted a geological section at Birdlip so I decided to draw it and label it.
Sketch of geological section
The second task we did was a cross-section which is measuring the width and depth of the water with a ruler every 10cm. We measured the cross-section at the following places: Buckholt Woods, Brockworth, Hucclcote and Innsworth. I went into the river or stream and measured the depth and width.
Measuring the width and depth of the river
The third task we did was the analysis of the grab samples which was only done at three sites which are: Buckholt Woods, Brockworth and Hucclecote. I got ten different stones or pebbles from each place and I measured its length, width and roundness. I found many different shapes and sizes.
Measuring the width and length of pebbles
The fourth task we carried out was to look at what the land was used for. At Birdlip I noticed that majority of the land was natural scenery with hills which some were steep. The view of Gloucester from Birdlip was good.
Birdlip – View of Gloucester
At Sandhurst there was a lot of natural scenery and vegetation. There were a lot of bridges which we had to cross to get to our destination. There was a muddy beach down by the river.
Muddy beach by River Severn
The river was also used for public use.
Boat on River Severn
We took quite a lot of photos of all six places we visited as each place had a beautiful view.
The fifth task we carried out was to see the environmental quality index. We carried out these task at all six places. At each place we gave a rating out of 5. The higher the number was the better the mark.
The sixth task we carried out was the velocity. We carried out this task at four places which are: Buckholt Woods, Brockworth, Hucclecote and Innsworth. This is where we put a dog biscuit in the left, middle and right of the river to find how long it takes to travel 10 metres. We carried out this task three times for accuracy.
Dog biscuit in River
The seventh task we carried out was the bedload analysis. This was where we picked three stones each from the left, middle and right of the river and measured the length and width of the stones. We also studied the roundness of the stones. We carried this task at the following four places: Brockworth, Buckholt Woods, Hucclecote and Innsworth.
Conclusion
From all the information I have gathered, I have come to the conclusion that the four questions which are based on my coursework have all been proven to be a ‘yes’ and a ‘no’. Below I will write each question and answer:
1) Does the depth of the river change from source to confluence?
– Yes, the depth of the river did change as the river at the sixth site was so deep that it was impossible for us to get into the river and measure it.
2) Does the width of the river change from source to confluence?
- Yes, the width of the river does change as again, we were not able to measure the width of the river at the sixth site as it was too wide.
3) Does the velocity of the river change from source to confluence?
- No, the velocity does not change from source to confluence as it was around 40 at site two and also around 4o at site five. This shows that the velocity hardly changed at site two, three, four and five.
4) Does the bedload of the river become smaller in size from the source to confluence?
- Yes, the bedload of the river became smaller in size from the source to confluence as at site two the length was around 8cm and the width 6cm and at site four the length was around 5cm and width 4cm.
I have answered these questions from the information I gathered from my coursework.
Evaluation
I am now commenting on my coursework. The methods were primary and secondary data. I used simple methods to carry out my tasks for the coursework. We did not have complicated equipment just rulers and dog biscuits. On the whole I think the equipment which was used worked out well for my coursework. The results I have were fairly accurate. We could have improved the results by carrying out each task several times but due to the lack of time we had to carry out each task we could not do so and also by using more accurate equipment. I feel that the conclusions I have made are correct and the details in my coursework show this.