The most severely affected populations in general are in Southern and Eastern Asia, which sit deep in the junction between the Eurasian, Pacific, and Indo-Australian plates. Between 1975 and 2004, South Asia alone made up 43% of people affected by hazards around the world while eastern Asia made up 41%. Populations in areas such as the USA, South America and Indonesia do not seem to be as badly affected by natural disasters despite being distinctively hazard-prone areas.
Fig.3 Population distribution 2000
Fig.3 shows the relative populations in each country.
It becomes clear by comparing Fig. 2 with Fig.3 that there are some countries whose dense populations are very rarely threatened by natural disaster. For example Europe contains a significant proportion of the world’s population but is almost invisible on fig.2. On the other hand, America and Japan show the same sort of population trends and yet are well known to be high-risk areas. By contrast, the dense populations of both China and India appear to have developed despite frequent high levels of natural hazard-related mortality.
I am now going to look in more detail at the global distribution of geophysical hazards in particular.
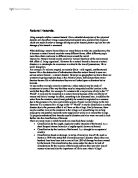
Fig.4 Distribution of Earthquake zones and Volcanoes
Fig.4 shows the distribution of earthquakes and volcanoes and how they are linked to the tectonic plate margins.
80% of the world’s active volcanoes occur along destructive plate boundaries; major volcano-prone areas include the North American-Pacific plate margin, the South American-Nasca plate margin, and margins along the Eurasian, Philippine and Australian plates. A small percentage of volcanoes occur on constructive margins, namely the North Atlantic ridge which produces gentle shield volcanoes. Volcanoes can also occur inside plate margins over areas called hotspots. One can see that Africa’s volcanoes are mostly within the area of the plate, and are products of hotspots rather than plate collision.
Fig 4 also shows the distribution of earthquake zones. Earthquakes can occur within any plate margin but there are three main fault lines between them that account for most of the world’s volcanoes; the Western Pacific, the Eastern Pacific, and the Southern Eurasian. Of these the destructive boundaries of the Pacific plate account for the worst and most destructive earthquakes. This map clearly shows that the distribution of volcanoes follows the earthquake zones in America and East Asia. Roughly 2/3 of volcanoes therefore occur in earthquake zones. The ‘middle’ earthquake zone follows the boundaries between the southern Eurasian plate and the Iranian, Indo-Australian, and African plates. It is by far the most active earthquake zone on earth but does not have any volcanoes.
Fig.5 Seismic risk
Fig.5 gives more information about the risk of an earthquake occurring.
One can see in both Figures 4 and 5 that although the pacific seismic zones are long and belt-like the area squeezed between the Arabian Peninsula and the Himalayas is both long and wide; Iran and Iraq are particularly badly afflicted. Slightly lower risk areas include western Australia which is very close to the Eurasian-Australian margin, southern Europe, again very close to the Eurasian plate margin, and more inland areas of America and Asia.
Fig.6 Death by earthquakes 1975 - 2000
Fig.6 shows the proportion of deaths worldwide by earthquakes.
China is in one of the highest risk zones for earthquake deaths, suffering 52% of the world’s total. Iran and Turkey have the next highest death tolls with Iran accounting for about 16% of the world’s earthquake victims. In fig.2, India is seen to be one of the most affected countries by hazards yet is significantly smaller in fig.6. India has a very low risk of receiving earthquakes.
The big death toll in Turkey is due mainly to a 7.6 magnitude earthquake that occurred in1999 killing 18000 people. Turkey sits on the Anatolian plate which is surrounded by the Eurasian, African and Arabian plates making it vulnerable on all sides. Istanbul, Turkey and Kathmandu, Nepal are the two most earthquake-prone cities in the world.
The Western American Coast and Japan are practically earthquake zones in their own right (both receive up to 6 or 7 significant (greater then magnitude 5) earthquakes per year) and yet do not seem to suffer from as many deaths as other high-risk areas.
Fig.7 Death by volcanoes 1975 - 2000
Fig.7 shows the proportion of deaths worldwide by volcanoes.
Volcanic eruptions occur less frequently than earthquakes and the relatively smaller amount of data makes it harder to analyse the distribution of their effects. Death tolls are on the whole significantly lower on a global scale than those caused by earthquakes.
86% of the world’s deaths from volcanoes in the last 26 years were in Armero, Colombia due to mud flows from the Nevado del Ruiz volcano, on 13th November 1985. It killed over 22 thousand people and devastated the area.
The second most severe volcano disaster in terms of human fatalities was in Cameroon which lies, like most of Africa’s volcanoes, on a hotspot. Mt Cameroon is the largest and most frequently erupting volcano in Africa. Between 1975 and 2000, the volcano erupted 3 times.
Indonesia boasts the largest concentration of active volcanoes (76!) of any country and has a relatively high mortality rate related to volcanoes. Between 1975 and 2000 Indonesia suffered volcano-related deaths in 9 out of the 26 years. It also has a recorded history of 1,171 eruptions which is only just exceeded by Japan with 1,274. Together, they share 1/3 of the world’s recorded volcanic eruptions.
In conclusion: I have shown that those countries with Pacific coastlines are at by far the highest risk from geophysical hazards. The subduction taking place around the Pacific rim causes both frequent earthquakes and frequent volcanic eruptions. By contrast the collision between the Eurasian plate and those colliding with it from the south is the cause of widely distributed earthquake-related hazards, affecting continental peoples more severely than elsewhere in the world. This area however has a relatively low occurrence of volcanic eruptions. Hydro-meteorological hazards remain, however, the most destructive of all natural disasters throughout the world. Of all human populations the Chinese nation is the worst affected by natural hazards, both geophysical and hydro-meteorological, in terms of sheer number.