To find out how channel characteristics such as width, depth, area, efficiency, gradient and bedload change downstream
.0 Introduction
Aims
. To find out how channel characteristics such as width, depth, area, efficiency, gradient and bedload change downstream?
2. To find out how flow characteristics, such as velocity and discharge change downstream?
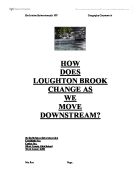
Having studied rivers to a great extent at GCSE and A level I have decided to carry out a study on river processes and characteristics. I have chosen the River Brett as the location for my study due to its large drainage basin and varying stream orders, enabling me to carry out a wide ranging investigation. The River Brett is a tributary off the river Stour in Suffolk. The river Brett's total length is 100 km.
Hypotheses
I plan to investigate the following Hypotheses:
) All of the river dimensions will increase downstream e.g. width, depth, area and hydraulic radius.
2) All of the flow characteristics will increase downstream such as velocity and discharge.
3) Bedload size will decrease and bedload shape will become smaller and rounder downstream.
Explanation of Hypotheses
I would expect the channel dimensions to increase downstream due to erosion of the riverbed and banks. Due to abrasion the width and depth would increase as material being carried down the river would rub against the bed and banks causing them to erode away. This in turn would cause the flow characters to increase due to there being a wider and deeper area for the water to flow through.
I would expect the bedload size to decrease and the shape to become smoother and rounder downstream due to the process of attrition. As the material travels downstream it rubs against each other therefore becoming smoother and rounder.
Background and Theory of river processes
. Hydrological Cycle
2. River Processes - Erosion
Deposition
Transportation
3. Other Factors affecting a river
Erosional Processes
Erosion is a process whereby material carried by the river wears away the bed and banks. It causes the river dimensions to become wider and deeper, or in the case of river material, smaller and rounder
Erosion occurs through four processes:
* Abrasion- A sand paper effect, where materials rub along the bed and banks of the river causing them to erode. This process is more effective during times of flood and is the major method by which the river erodes both vertically and horizontally.
* Corrosion/ solution- A chemical reaction that happens between rock and the water e.g. the concentration of carbonic acid and humic acid. This happens continuously and is independent of river discharge and velocity
* Attrition- This is the erosion of the bedload of itself. Boulders collide with other materials causing them to break and become smaller and rounder in appearance.
* Hydraulic Action- Due to the force of the river, water is forced into cracks along the river bed. The air in the cracks is compressed therefore pressure increases and in time the bank will collapse. This is the slowest and least effective erosion process.
Depositional Processes
Deposition is where the velocity of a river looses its energy and is no longer able to carry it's load Material is deposited, starting with the largest particals.
Deposition occurs when:
* Discharge is reduced following a period of low precipitation.
* Velocity is lessened on entering the sea or a lake
* shallower water occurs on the inside of a meander
* the load is suddenly increased (caused by an increase in farming or a landslide)
* the river over flows its banks so that the velocity outside the channel is reduced ; resulting in a floodplain.
Transportation Processes
This is where excess energy is used to transport material down the river. As the velocity and turbulence increases, so does the ability to entrain materials.
The load is transported by three main processes.
* Bedload- This is where larger particals, which cannot be picked up by the current, are transported along the river bed. they are inturn transported in two ways: Saltation, where pebbles, sand and gravel are temporarily lifted up by the current and bounced along the bed in a hopping motion and Traction where cobbles and boulders are rolled along the bed. The very large material may only be moved at times of flood.
* Suspended load- This is where very fine particles of clay, silt and sand are carried by the turbulence of the river. The higher the velocity the bigger the particle that can be entrained. The suspended load is what gives the river its brown, black colour.
* Dissolved or solution load- This is where soluble rock such as limestone is dissolved and removed in solution by the constant running river.
Explanation of factors affecting a river.
* Basin size, shape and relief- If a drainage basin size is small, round and steep sided, rainfall ...
This is a preview of the whole essay
* Suspended load- This is where very fine particles of clay, silt and sand are carried by the turbulence of the river. The higher the velocity the bigger the particle that can be entrained. The suspended load is what gives the river its brown, black colour.
* Dissolved or solution load- This is where soluble rock such as limestone is dissolved and removed in solution by the constant running river.
Explanation of factors affecting a river.
* Basin size, shape and relief- If a drainage basin size is small, round and steep sided, rainfall will reach the river more quickly decreasing lag time and increasing velocity.
* Intensity of precipitation- The heavier the rainfall, the more saturated the ground will become therefore, not only will river fill up more quickly due to the heavy rainfall, but water will also flow faster to the river as surface runoff.
* Temperature- Extremes of temperature can restrict infiltration and so increase surface runoff. If evapotranspiration rates are high then there will be less water available to flow to the main river.
* Land use- Urbanisation- Has an increased flood risk due to water being unable to infiltrate through the tarmac or concrete. Farming- Over cultivation of the land surrounding a river may mean that the soil is more easily eroded causing a build up of silt in the river and an increased risk of flooding. The loss of vegetation may also mean a higher flood rate as water will flow more easily through the soil. .
* Vegetation- Large amounts of vegetation inhabiting the river, its banks and bed effects its velocity and therefore the amount of erosion.
* Relief- A higher relief will mean that materials will flow faster down to the river.
* Geology- Impermeable rock will restrict the water form being infiltrated so therefore will travel more quickly to the river as surface run-off. PErmaeable rock will infiltrate the water so the ground becomes saturated. The water will travel more slowly through the permeable rock before reaching the river.
How rivers work
Precipitation ( River Basin Characteristics ( River Channel Characteristics
-Relief, Shape, vegetation - Depth, width, velocity, relief,
land use, Geology and soils, efficiency
( (
River Flow
(
Energy
Equation = 1/2 mv ²
( Erosion
River Processes ( Deposition
( Transportation
( (
River Load River Features
- Oxbow lakes
- Deltas
2.0 Methodology
The River Brett is a tributary of the River Stour near Hadleigh in Suffolk. We have chosen fourteen different sites along the course of the river (see fig ....)
Sampling Strategy
In order to obtain our results we had to decide on a sampling strategy. This depended on: 1) The amount of time we had to visit the sites we needed to complete our investigation 2) The state of the river i.e. if it was feasible for us to obtain the results we needed, depending on the height of the river and velocity. 3) How many people there were to visit and take measurements at each site and 4) the availability of transport to take us to the sites.
We decided that we needed to visit fourteen sites with varied stream orders to enable us to provide a significant range of results and therefore accurate representation of the River Brett's characteristics.
BRETT MAP HEREMethods
Measuring Channel dimensions
To measure to the width we used a tape measure and measured it three times at each site to get an accurate result.
To measure that channel depth we used a ranging pole/ metre stick and inserted it at eight intervals along the width of the river, we then took an average of these results.
To measure cross sectional area = mean depth x width DIAGRAM
Measuring flow characteristics
To measure velocity we inserted the flow meter into the water at three intervals and took an average.
To measure discharge we used the measurements from the velocity and cross sectional area. DISCHARGE= Velocity x cross sectional area
To measure hydraulic radius (efficiency) (low flow)= Area
Wetted Perimeter
DIAGRAM
(High Flow)= Area
Bankfull Measurement
Measuring Bedload Size and shape
Bedload Size- A selection of twenty stones were collected (at random). These were selected walking in a straight line across the width of the river channel.
Bedload shape- The same twenty stones were judged using the roundness code. This had a scale of 1 to 6.
Safety
As we were working within the physical environment there were a number of hazards and safety issues we had to address
) Weil's disease- This is a bacterial infection which is a very widespread, if untreated in very serious conditions it can be fatal. We had to be careful of this due to the low flow of the river, which could have attracted the disease in a dormant state. We insured that all cuts were covered with a plaster.
2) Water- In some areas the water was very deep (pools), fast flowing and in some places slippery. We were careful when at the sites and tried to chose sites that were the most safe.
3) Vegetation- There were over hanging branches and nettles at most f the sites we visited. We all wore wellies and tried to avoid the hanging branches.
Evaluation of Methodology
As my investigation is of a physical nature, a majority of the data that I collected was primary. This was an advantage, in one perspective, as I knew that all my data was true, but a disadvantage as it is hard to get a 100% accurate result. There were a number things I had to do in order to gain more accurate results.
) Make sure that the measuring tape was taut when measuring river dimensions.
2) When collecting the bedload stones, make sure they were all of a varying size and from along the width of the river. This would insure I didn't get a biased result.
3) Making sure, when measuring the depth that I didn't place the metre stick on a big boulder, that was uncharacteristic of that part of the river.
4) Appreciate that the flow metre needed a certain minimum depth in order to take an accurate reading. Also not standing in the way of the flow to the flow metre, decreasing the velocity of the water to the flowmetre.
4.0 Analysis
Method of analysis
To find the relationship between the characteristics of a river and the distance down stream I am going to use two methods to analyse my results. Firstly I will present my data graphically using line graphs, and look for patterns and correlation's within and between sets of data. Secondly I will interpret my results by calculating the Spearmans' Rank Correlation Coefficient.
* Line Graph
A line graph can be made by plotting each pair of data as a single point on the graph. The points are then joined up to make a line. By studying these plotted points I can see if there are any correlation's between the river characteristics and the length of the river.
If the points lie close and with a positive gradient, this suggests that there is a positive or direct correlation between the two sets of data. IF they lie close with a negative gradient, this suggests that there is a negative or inverse correlation between the sets of data. If the plotted points do not follow any pattern, this suggesta that there is no correlation between the sets of data.
* Spearman's Rank Correlation Coefficient
As a line graphs do not give a completely clear and accurate representation of the results I am going to use the Spearman's Rank Correlation Coefficient test to analyse my data. A spearmans rank correlation test is one which can be calculated using the ranks assigned to sample members as data.
The Spearman's Rank Correlation Coefficient can be found by using the following method:
) Fill the tables in with distances downstream in the first 'value' column
2) Rank them in order from 1 to 14, from the smallest to the biggest
3) Do the same for the different characteristics in the second 'value' column.
4) Find the differences (d) between the ranking and then square them (d2)
5) Add up all the d2 value (= d2 )
The correlation coefficient can be found by the following formulas
Analysis
Dimensions of the river
Width-
From the graph I can see that there is definitely a correlation between channel length and width. There is a positive increasing gradient showing that, as the channel length increases, so does the width of the river. The width slowly increases along the first six Sites from the source with an increase of only 0.8m. Along the next eight sites from Well's hall, downstream there is an increase of 6.9m. This is also due to an increase of 3-4 in Strahlers theory of stream orders. There are however two anomalous results at Wagger farm and Cherry Hill indicating a lack of velocity, hence erosion perhaps due to the amount of vegetation present at these sites.
In support of my results the Spearmans Rank Correlation Coefficient can also show the that there is a strong positive correlation. As the correlation coefficient in very similar to 1 (0.953), this rejects the null hypothesis, which means statistically there is a positive correlation. between the length of river channel and and the width. Since the correlation coefficient is greater than the critical value of 0.544, i can be 95% sure that this relationship didn't occur by chance.
In conclusion, I can say that the width does increase the further downstream you go.
Depth
The result from graph 2 show that there is a positive gradient, so therefore as the length of the channel increases so does the depth. Much like the width dimensions, there is a slow increase along the first 10 sites of about 8cm, along the following 4 there is an increase in depth of roughly 10cm. There are slight negative fluctuations in depth about of about 5mm at Kersey Vale, Wattisham and Wagger Farm, this is probably due to the unevenness of the river bed due to deposition of large rocks causing an anomalous result. The Spearmans Rank Correlation Coefficient is very close to 1 (0.946)
In conclusion I can state that the depth does increase the further downstream you go
Flow Characteristics of a river
Discharge:
Form the graph you can see that there is a positive relationship between discharge and river channel length. The discharge increases slowly until Wagger Farm (point 10). There is then a huge fluctuation where the discharge rises at Cherry hill by 500 L 2-1 and then falls at stone street by 350 L2-1 and then rises again by 500L2-1. This does however support the cross sectional area and velocity results, as they both fluctuate in the same way.
This result can also be supported by Spearmans Rank Correlation Coefficient as the value in very near to 1 (0.978) thus showing that there is a positive correlation between river discharge and channel length. Since the correlation coefficient is greater than the critical value (0.648), I can be 95% sure that this relationship is not due to chance.
In conclusion I can say that my hypothesis was correct and that the discharge does increase with channel length. This is due to more tributaries joining the river as it goes downstream, this also supports Strahlers theory of stream orders. The increase in river discharge will contribute to the increase in velocity of the river.
Hydraulic radius
Cross sectional area
Gradient
Velocity
Bedload size
According to the results I have obtained, there does not seem to negative correlation between bedload size and distance downstream which was to be expected.. Surprisingly there is a slight positive gradient suggesting that the bedload size is bigger further downstream. There is a big fluctuation between Monks Eleigh and Cherry Hill suggesting that there has been a lot of bed and bank erosion, most probably hydraulic action, breaking big bits of material off
According to spearmans rank correlation coefficient, there is a very weak positive correlation between the two factors, however the result (0.243) is below the critical value (0.544) so therefore it I am less than 95% sure that this didn't occur by chance.
Bedload Shape
Very uneven results have come from this aspect of the investigation. The results do not follow any particular pattern i.e they don't become smoother and rounder at sites going downstream e.g at Wagger Farm the bedload becomes more angular. However, over all, there is a very weak posative correlation, showing that they do get smoother and rounder downstream. This is also supported by Spearmans Rank Correlation Coefficient, as the coefficient is near to 0 (0.333). Therefore there is a very weak correlation, however it is stronger than the relationship between bedload size and channel length. According to the shape code the majority of the material is angular, subangular and subrounded (see appendix for codes)
In conclusion I have found that in contrast to my hypotheses, the bedload size slightly increases the further downstream, however the shape of the bedload does become slightly more smoother and rounder. These findings could be due to the geology of the area. The local soil is glacial morraine and is not easily eroded at any stage of the river. Due to the increase in hydraulic radius, and therefore erosion, further downstream, there would be chunks of material being eroded from the banks which would have been waekened.
Hydraulic Radius
Higher Hydraulic Radus values indicate a channel which is more efficient
Conclusion
Having thoroughly analysed my results, through examining the data collected I can now make the following conclusions.
My first hypothesis stated that 'All of the river dimensions will increase downstream e.g. width, depth, area and hydraulic radius'. My analysis has shown this hypothesis to be correct. All of these dimensions would increase due to the process' of erosion and deposition. As the gradient of the land decreases, the river meanders, following the natural gradient of the land. The outer banks of the bend are undercut by the faster current into cliff like slopes called undercut slopes. Eroded material is deposited on the inner bank (pointbar) due to the slower current not being strong enough to entrain the material. This process of erosion and deposition causes the river to become wider and deeper.
My second hypothesis stated that 'All of the flow characteristics will increase downstream such as velocity and discharge' and I have proved this to be correct through investigation. The discharge increases due to the increase in velocity and cross sectional area which occur further the downstream you go. The discharge also increase's due to the increase in stream order i.e more tributaries have joined the river and therefore contributing to the flow. The increase in velocity is due to a number of factors: gradient (relief of land), efficiency of river (roughness of channel) and cross sectional area. The steeper the gradient the faster the water is going to flow. The gradient lessens closer to the mouth so the velocity should decrease, however the channel efficiency increases (the bed and banks become more smooth) so there is less friction and therefore water is allowed to flow faster.
My third hypothesis stated that 'Bedload size will decrease and bedload shape will become smoother and rounder downstream.' My results for bedload size have contradicted my hypothesis, as my results showed that bedload size overall increased downstream, however there was a very weak correlation showing this. Bedload shape however did become smoother and rounder downstream supporting one of my bedload hypotheses. The fact that bedload size doesn't change but shape does, could be due to the geology of the land, as glacial morraine is a hard rock and is not easilty eroded, however attrition would have been able to smooth rough edges but not erode the material enough to decrease the size.
In conclusion I can say that the majority of my hypotheses were true.
Evaluation
My results were fairly accurate but there are some factors that need to be taken into consideration which could have altered the results.
Firstly, the weather. It was very dry and hadn't rained for some time. The river was very low so this could have made the velocity uncharacteristically slow. Also there was people standing in the river, which could have caused more friction, and therefore the velocity would have decreased. Some of the sites were surrounded by trees, being autumn when the investigation was carried out, leaves may have fallen into the river causing an obstruction to the flow