Secondary data is data which someone else has found out, for example, books, census data, newspapers or the internet. The advantage with secondary data is the fact that someone has found it for you, and they probably have more knowledge of the subject than you.
A transect is a route which you have chosen to take. We used a transect, to see the changes with distance. A disadvantage to taking a transect is you’ve only done one section of a large area, and they may all be different. We choose the route, which is on map , this route was chosen because it is a good example of how houses change from the CBD outwards. The stopping points which we stopped at are as followed;
- Sutton Road
- Fallow Field Road
- Grove Hill
- Sutton Road
- The Willows
- Moncrieff Street
- Tong street
- Tantarra Street
- Eyland Grove
10. CBD centre of Walsall
On sheets are blank copies of data collection sheets which I used, as I walked along the transect.
We walked along the transect, and stopped at points 1-9 as we walked, and stopped, I filled in recording sheets, and took photos at each point, we ended up in the CBD and answered our questionnaires, by asking people who were in the CBD.
The data I collected, and how:
- The type of housing, I made a recording sheet and all I had to do, was to look at the housing, and decide which one it was, then I ticked the box, depending which house type it is.
- For the age of the housing, I used sheets, which described the features of different housing ages.
- For the features of the house, I looked what the house had (amenities) and ticked the boxes, depending on what it had.
- I also sketched one house at each stopping point.
- I completed the quality of environment table, which was just simply putting a mark on how good or bad that stopping point was.
- I recorded the type of house along the whole transect, but I found it hard, to keep writing it down, as I was walking, so I didn’t complete it, if I was to do this recording again, then I would do this on a separate time to the rest of the recordings which I did.
Using primary data, there will be variations in housing along the transect with distance from the CBD
It is expected that the age of housing decreases as you go from the CBD outwards, because buildings grew up, and outwards. It shows that the buildings grew outwards, on Burgess’s model, which is shown on page .
Actual results
The results do actually show that the father away from the CBD you go, the more modern they are, there were two anomalies, which were Tong Street and Tantarra Street. There is a reason why there are these two anomalies, the high rise flats which are on Tantarra Street, are because, there used to be slums in the inner city, which were needed to house workers who worked in the factories, the factories built these, an they were small an built quickly, they were back to back, and people were living in very unpleasant conditions. So they cleared all of these slums, and had no-where to re-house the people who lived in these back to back houses, so they built these high rise flats, which don’t take up much room, and there are a lot of them, and they are cheap to build, so everyone was re-housed in these flats. The reason for the anomaly on Tong Street, is because of something called inner city redevelopment, they are trying to update the inner city, so more people will want to live there, an advantage to these houses, is the fact that they are so close to the CBD people can get to the CBD easier, and they can get onto main transport routes easier. With the acception of the anomalies, this fits in with Burgess’s model theory, which is on page , as the older houses are towards the CBD, and the more modern houses are away from the CBD.
Conclusion
I have found that for the age of houses along our transect, fits in with Burgess’s model, with the acception of the anomalies, my expected results were true. I accept my Hypothesis, as it fits with the results which I found.
It is expected that in the outer suburbs, there are mostly detached, then as you move towards the CBD it goes, semi-detached, terraced, with flats slotted in somewhere. Because, as people moved father away from the CBD there was more land for people to build larger houses on.
There are sketches and pictures of the housing at each of the stopping points, on pages
The results show that the father away from the CBD you get the larger the houses get, it goes, (from CBD outwards) Flats, high rise flats, town houses, terraced, semi-detached, semi-detached, mixture of semi-detached, bungalows and detached, then finally detached. The anomalies, which are in Tong Street, are the town houses, these are here due to inner-city redevelopment. The other anomalies were the flats, but they were expected, due to when they cleared out the old inner city and replaced it with flats to re-house people who used to live in the back to back housing. This also links to the burgess model theory which is on page , as it was meant to grow outward, and have more space as you go outwards, which is true.
Conclusions
I have found that the types of housing changes as you go from the CBD out wards, and that the houses are larger as you go from the CBD outwards. It fits in with my expected results, except for the anomalies. I accept my hypothesis, as it fits in with the results. This fits in with the theory, as the houses are meant to get larger, and more modern, from the CBD outwards. For example the inner city is made up of mostly detached housing, and the outer suburbs, detached housing.
Using secondary data, the characteristics of housing along the chosen transect will change with distance from the CBD
- Housing tenure
- Car/van ownership
Tenure is who owns the house, whether they own it themselves or rent or anything else. This is shown on census data. This links to the theory, as the inner city houses, are smaller, but also expensive, as the land closer to the city is more expensive, as everyone wants to be closer to the city, so most people rent housing. In the suburbs people mostly own their own houses, as land is cheaper, and if they can live that far from the CBD they must be able to afford a car, so they can get into the CBD.
I would expect the houses to be more council owned closer to the CBD, as land is more expensive, and people want to live close to the CBD for jobs, as they may not be able to afford cars, and they may not be able to afford to own their own house, so they rent it off the council. I would expect there to be more owner occupied father away from the CBD, due to cheaper land, and people are more likely to have cars, so they can travel to work, instead of needing to walk.
The information which I have selected from the census data is owner occupied and council owned. (Census 2001)
The choropleth map on page show the housing tenure across the wards of Walsall.
Conclusion
The chloropleth map on page shows that there are more people who own their own houses in the streetly are, and less people own their own house closer to the M6 motorway, either side.
Whether someone owns a car, or a van, is a proof of wealth, as that means you can live further away from the CBD, as you can afford to travel there.
The information which I have selected from the census data is car/van ownership of 3 cars. (Census 2001)
The choropleth map on page shows the ownership of 3 cars/vans across the wards of Walsall.
Conclusion
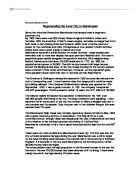
The chloropleth map on page shows that Streetly is the place where there are most people who own three cars. There seem to be more people who own three cars on the east side of Walsall. There are less people who own three cars closer to the motorway.
Spearman’s rank
On page is the Spearman’s rank, which compares home occupied, with car ownership. I chose this, as car ownership represents wealth, therefore you would be able to afford your own house. There is a strong positive correlation between car ownership and owner occupied, which means these two factors actually effect each other.
Using the results from the questionnaires, I am going to find out about problems with housing, and solutions which are either in progress or something which I think can be improved by the use of the quality of environment table I completed whilst on the trip.
I expect that there are fewer problems in the houses father away from the CBD, as they are newer and the people who live there have more money to spend improving their houses. I also expect there to be more problems in he CBD, as the houses are older, and people don’t have as much money to spend on improving their properties. I also expect there to be some inner city redevelopment, as there are not many factories around now, so they needed something to put in there place.
I completed a quality of environment table as I walked around each site; these are the results of this:
The scores are out of 10, 1 being very poor, and 10 being excellent.
The graph to show this data, is on pages
In this table there are a few anomalies, which are actually examples are inner-city redevelopment.
As I walked around Walsall’s CBD, I took out a questionnaire, and asked people about where they lived, and then when we got back to school, we got into groups, and collated our results. Below are the results which I have:
33 people in total were asked these questions:
The graphs to show this information are on pages
From doing this questionnaire, I have found out that the most dominant problem is litter; everything else seems to be ok.
When I was walking around, I observed that they had actually made improvements to the terraced housing in Moncrieff Street; they had added new double glazed windows, and other things like changing roof tiles. There was also the inner-city redevelopment, which is the town houses in Tong Street, and the flats in Eyland Grove.
From doing this hypothesis, I have found out that there are actually not a lot which people think can be improved, the one problem is LITTER, some things which I think could be improved include things just like, paint work, roof tiles, and drives, mostly cosmetic. This could be solved, by people doing this themselves, or if their house does not belong to them, then the owner, should make these repairs.
Solutions which are in process from the local council
There are a few schemes that are set up on the internet, that are trying to help in reducing the problems in society. I have found some information on the internet, from the Walsall Metropolitan Borough Council is trying to run. Its aims are to empower residents in targeted local communities, enabling them to exercise real power over resources, to tackle the physical and social problems of their areas and to equip them with the motivation, skills and qualifications to obtain employment in and beyond the Borough. They will hold community elections, and will provide local people with resources to enable them to improve and manage their housing, upgrade the local environment and live in a safe, healthy, sustainable and stimulating environment. They are trying to get residents involved in making Walsall a safer place to live in.
My aim was ‘to investigate whether housing along a transect from the centre of Walsall matches the models of urban land use. To explain this, I am going to use the urban zones.’
First I am going to take the outer suburbs. In Walsall this zone goes along the Sutton road, until you get to fallow field road, where there is a mixture of detached, bungalows and semi-detached. I think that the outer suburbs stop here, and the suburbs begin, as there is semi-detached housing. The detached houses in the outer suburbs are large and they have gardens, drives, and garages. This zone is similar to Burgess’s model, as it has the characteristics of outer suburbs, and it’s by greenery, which is the green belt land around the edge of a town or city. There is a very noisy road, which runs in between these houses, it is needed to get into the CBD, and other places. A way you could overcome this is, as the cars are very noisy, traffic calming schemes, so there isn’t so much traffic.
The next zone I’m going to take is the suburbs. In Walsall this zone goes from part of Fallow field road, to grove hill, to the bottom of the Sutton road, up to the willows. This is the last stopping point with semi-detached housing. I think that this is the suburbs, as it has semi-detached housing, which have drives and gardens, most garages were added later than when the houses where built. This fits in with the theory, of Burgess, as it is the suburbs, I know this because it has the characteristics of the suburbs. The only problems in this area was mostly things like, improving cosmetic parts of the houses, such as paint work, which is up to the house owners to look after.
The next zone is the inner city. This starts on Moncrieff Street, and finishes just before you get to the CBD. This is made of terraced housing, new redevelopment, which are the town houses in Tong street, and then there are the high rise flats in Tantarra Street and low rise flats in Eyland Grove. The only characteristics of this area which fits in with this area and the Burgess model is the terraced housing, which are in a grid-iron pattern. The thing was Burgess wasn’t to no at this point that there would be inner city redevelopment, or the clearing of back to back housing being replaced with high-rise flats (COMPREHENSIVE REDEVELOPMENT) there are problems within this area, but there are schemes already in process- inner city redevelopment.
The last zone is the CBD, the border of this is by Eyland grove, as this is where the shops and offices start to appear. This fits in with Burgess’s theory, as there is not much space to build anything in the CBD, it is mostly shops and tall buildings, and all main transport roots run through the CBD. The most obvious problem is litter, but there are plenty of bins, and there are machines, which people use to clean up the litter.
My project could be improved, by investigating more variables for my hypotheses, and if I were to collect my data again, I would do it another way, as when I was walking around, I had trouble with all of the sheets, and I found it hard recording the housing along the transect, and if I went on the trip again, I would go on a separate day to do the transect. To extend my project, I could look at more transects in Walsall, and compare other similar sized towns to Walsall, I could also concentrate on other factors instead of housing, such as land use, and environment. Also, I could concentrate on one zone, from Burgess’s model, or find a town which Hoyt’s model works with.
Widerworld page 26, for the Burgess and Hoyt models
2001 Census Data
Walsall Metropolitan Borough council web site
Thank you to:
Miss Stafford and Miss Wharton for coming on the trip with us.
Miss Stafford, for helping me with my coursework.
The people who answered the questionnaire for us.
My friend Avneet who helped me to find the information for the internet research for schemes which are in process from the local council.
Page 1
Page 2
Page 3
Page 4
Page 5
Page 6
Page 7
Page 8
Page 9
Page 10
Page 11
Page 12
Page 13
Page 14
Page 15
Page 16
Page 17
Page 18
Page 19
Page 20
Page 21
Page 22
Page 23
Page 24
Page 25
Page 26
Page 27
Page 28
Page 29
Page 30
Page 31
Page 32
Page 33
Page 34
Page 35
Page 36
Page 37
Page 38
Page 39
Page 40
Page 41
Page 42
Page 43
Page 44
Page 45
Page 46