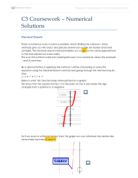
As an example I have used to demonstrate it is the f(x) = x5 + 6x2 - x + 4
Below is how the graph looks like :
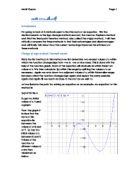
When I re arrange the equation in the form of x= g(x), it turns out to be this:
When I plot this against the y = x graph, this is what the graph looks like:
This is the visual representation to what happens as x= G(x) gets closer and closer towards the root (staircase).
This shows that after every iteration, I get closer and closer towards the root. After 19 iterations, I found the root of the equation as from then on, it repeats. So the root of the equation x=G(x) against y = x graph.
Failure of Rearrangement method
There are situations where this method doesn’t work. When I re-arrange f(x) into a different x = g(x), it does not converge to the point when I go through the iterations. E.g. I re- arranged f(x) to:
If I plot y = g(x) against y = x, it looks like this:
Looking at this, it implies that the root is between -1 and 0 When I do the iterations starting at the point -1, it turns out like below. The green line is my original equation showing my real root and this clearly shows that the root that is being implied by the y = g(x) graph is wrong. The iterations are also wrong as they diverge away from the point as well.
If you differentiate the y = g(x) function and substitute x for the approximation of the root. If that g’(x) < -1 or g’(x) > 1, then we know that the function will not converge to the root but will diverge away.
e.g. Let us take a the last g(x) function possible from my f(x) function.
x= x5 + 6x2 + 4 → g(x) = x5 + 6x2 + 4
g’(x) = 5x4 + 12x
From this graph, you can se that the starting x value for the iteration would be -2
G’(x) = 5(-2)4 + 12(-4)
G’(x) = 32 → 32 > 1 there fore this function should either overflow or diverge away. Here is the proof:
Newton Raphson method
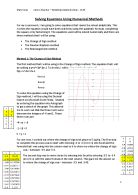
This method works by plotting the f(x) on a graph and visually looking at between what two points the root is (in single units such as 1 or 5 or 9). Then we draw a tangent at that point on the graph. E.g. if the root is between 1 and 2, then you draw a tangent at x= 1 point on the graph. Then we look at where the tangent crosses the X axis and that value will be the new x value on the graph for a tangent. This repeats until we find the root of the equation, (when x value starts repeating or reached enough significant levels). I will attempt to solve f(x) = y = x³−6x²+2x+2
Here’s y = f(x) plotted:
From the graph, we can tell that roots are between (-1 and 0), (0 and 1) and (5 and 6). So we draw a tangent at x=-1 point on the graph. To do this, we need to find the gradient at that point. To get this, we need to find Y’.
When we substitute in x = -1, we get . So gradient at that point is 17.
The Equation of the tangent at x = 1 and with grad -7 can be found using the formula below as we know that when x = -1, y = -7 by substituting (-1) in the f(x) : (-1)3-6(-x)2+2(-1) + 2 = -7
This is the tangent drawn:
From the equation, we can work out where the line crosses the X axis by making
equal to 0:
-0.58824
So now, our X1 value is -0.58824 instead of 0. We can generalise this into the formula:
So, now using the formula, we can work out the next X value:
X1+1 =-0.58824 - f(X-0.5882)/f’(X -0.5882)
X2 = 0.58824 –
X2 = 0.44402
This summarised and finalised in a table from the Software Autograph:
After the fifth iteration, we started repeating the value of X, this means that we have found a root for the equation Y = x2 - 6x +3
From the table above, you can tell that the root has been achieved completely after 7 iterations as the ∆x is 0. But after the 4th iteration, we have reached a point where the x value started repeating due to the fact that this was to 4 decimal places. This is not accurate enough as I want it to be to 5 decimal places. So I used the formula to work out the values in excel. Here are those results:
After the fourth iteration, we reach the root -0.42362 ± 0.00005
I used use the same method to work out the other two roots. Here are the results for the both these roots. I used excel to work these out.
Root number 2:
Root number 2 is 0.84653 ± 0.00005
Root number 3
Root number 3 is 5.57709 ± 0.00005
Where it does not work
This method does have a flaw. If I choose to work out the roots for the equation f(x) = 4x2 – 24x + 35 using Newton Raphson method, I find this:
Looking at this, I would expect the roots to be between [3 and 4] and [2 and 3]
I could find the root between 2 and 3 by using the method and it works prefectly to give the value 2.5. But when I try to find the root between 3 and 4, the method fails.
From this, you can see that the tangent has a gradient of 0, therefore does not cross the X axis so we will not get a new Xn Value to carry out the iterations.
Another way of looking at this is using the formula. At the point x = 3, there is a turning point. Therefore the gradient will be zero. This will mean that the gradient function will equal to zero. If we take a look at the Newton Raphson formula, it’s denominator is the gradient function of f(x). If the gradient function is zero, that will mean that the denominator is 0 and that is an impossible fraction.
Comparisons of the methods:
Now to compare the effectiveness of all the methods, I will attempt to solve exactly same equation, using all three methods. The equation that I will use is y = x5 + 6x2 - x + 4
Rearrangement method
I am using the same equation I used for my Re-arrangement above so the results will be exactly the same. So using the Re- arrangement method to solve f(x), I find that the root is -1.961703555,
-1.96170 ± 0.00005
Decimal Search
This is where we look at between which two points the sign changes from a positive to negative. Similarly to before, I used excel to work out the value of f(x). To start the process, we have to select two points on the graph visual basis. Looking at the graph you can see that the root is between -2 and -1:
The root of the function f(x) is -1.961705 ± 0.00005.
Newton Raphson Method
Finally, I am going to use Newton Raphson method to work out the root. I am going to use the inbuilt function in AutoGraph to work it out initially and then I will use Excel to work the root out to more decimal places.
Because this only works out the value to 3 decimal places, I will use the Newton Raphson Formula to work it out to 5 decimal places. I will summarise it in a table like previously
So I have to work out F’ of my equation.
From my graph, I can see that my X0 will be -2. To work out X1 I will use the formula above to work out X1 in steps and will repeat it to find a root to 5d.p and summarise in a table:
Here are the results from the Iterations:
Using this method, the root of the equation is -1.96170. All the methods have given me precisely the same root at 5.d.p.
Conclusion
All three of methods, have situations where they all work, situations where some fail. Out of the three, some are faster at converging to the root that others and some are easier to use than others, especially with the recent technology made available to everyone.
Decimal Search method
This method is by far the easiest and requires least amount of mathematical skill as it requires no complex calculations whatsoever except subbing in X values into the original equation. But with Computers being able to do even that, it makes it even easier to use it. So the only human interaction needed is to look at the results and manually looking at between which two points (limits) there is a sign change and then setting the new limits as such. But regarding the speed of convergence, this is relatively low as it is not completely automated and requires human interaction after each set of results and is very repetitive. Despite this, it is a very effective method as failure chances are relatively very low and the root can be found to many decimal places if the right software is used. With the use of excel, it can be really easy to work out the values of y when you sub in the x values. Writing the formula in a cell and dragging it down so it is easier to calculate the y values for various points of x. Using Autograph is much, much simpler as you have the ability to zoom in on the point where the signs change, i.e. the point on the X-axis, and can do so to many places. This makes it much easier than excel but and is almost accurate as it is because it gives the root to 8+ decimal places and that is accurate.
Fixed point Iteration
This method is probably the hardest method to use out of the three. It involves rearranging a y = f(x) formula into x = g(x), by using any one of the x values in the f(x) formula. This method is slightly complex even on easy formulas, but when we get really complicated when harder formulas are introduced. This is the hardest bit of the method as the iteration part is really simple, especially with the use of automated software/computer. Most of the mistakes are made in this stage by humans. The downside of the method is that it is the most likely method of all three to fail as there is always a chance that when you rearrange an equation and start the iterative process, it will not converge to the root but it will diverge away. The chance of this happening is quite high. As for the speed of convergence, it would be slower that Newton Raphson because of the extra time needed to re-arrange the equation but it is faster than Decimal search. With the use of Excel, it is very easy to enter the x = g(x) formula in to work out the new value of x and using it for the next iteration by simply dragging down the formula as many cells as you wish (each cell = an iteration). This makes it very easy to work out the repetitive part of the method and makes the speed of convergence much faster. With the use of Autograph, plotting y = g(x) against y = x graph and selecting them both, clicking on x = g(x) iteration and then selecting a starting point to start the iterations. This makes it even easier than excel but it is less accurate as it only gives the root to 3 decimal places where as excel can be configured to as many decimal places as needed.
Newton Raphson
This method involves working out the gradient function of the graph which is relatively easy even if the equation is complicated. This is the only hard part of the method as the iterative part of the method is very simple with the use of the formula. If automated software/computer is used then it becomes even easier. Regarding the speed the convergence, this is by far the fastest to converge to the root and it is also the method which fails the least out of the three different methods. With the use of excel, it is every easy to write down the formula of the method in one cell and dragging it down as many cells as you wish to (the number of iterations) and it is very easy to use. With the use of AutoGraph Software, It is even easier as you don’t even have to work out the gradient function. All you need to do is just enter y = f(x) formula and then select the graph and select the Newton Raphson iteration and then selecting you X0 point and click as many times as you want on the arrow (each click = an iteration). This makes it much easier than excel but it is again less accurate as it only gives the root to 3 decimal places where as excel can be configured to as many decimal places as needed.
Overall, all the methods and both the software I used have circumstances where once of them is better than other and circumstances where one completely fails or is much longer. But with ever growing technology, there might already be software that solves the roots of an equation after entering the formula in. But whichever bit of software you use, it is hands down the easier way of finding the roots of an equation.