4.2 TEST SELECTION AND FULL EXPERIMENTAL RATIONALE
Four tests were used in order to specify the aims of the project:
- Discrimination Testing
- Descriptive Analysis
- Acceptance Testing
- Preference Testing
Triangle Test
The test that was chosen in order to find out if there was a significant difference between the two brands was the triangle test, which belongs to the general class of discrimination or difference testing. Discrimination testing “is used to determine whether there is a perceptible difference, or are differences, between two or more products and, in some cases, the magnitude of the difference” (Lyon, Francombe, Hasdell, Lawson, 1992, p.23). Apart from the triangle test, within this general class are two other tests, known as the paired comparison test and the duo-trio test.
According to Stone and Sidel (1993, p.152), “the triangle test, as its name implies, is a three-product test in which all three products are coded and the subject’s task is to determine which one is most different from the order two”.
Triangle test was chosen since it is the most well known and efficient difference test. It was also chosen because it is the most suitable method of overcoming difficulties associated with the directional-paired method. It is however, a very difficult test since the panellists must recall the sensory characteristics of two products before evaluating the third. Furthermore, “the chance probability associated with this test is only 1/3” (Stone & Sidel, 1993, p.152).
Descriptive Analysis Test
The descriptive analysis test was the second test undertaken, so as to determine the differences in taste, colour, smell and texture of the two products (Ribeena and Tesco blackcurrant squashes). “Descriptive analysis is a sensory methodology that provides quantitative descriptions of products, based on perceptions of a group of qualified subjects. It is a total sensory description taking into account all sensations that are perceived – visual, sensory, kinaesthetic, and so on when the product is evaluated” (Stone & Sidel, 1993, p.203).
Therefore, descriptive tests are used to describe the sensory characteristics of a product, and to use these characteristics to quantify differences between two products.
According to Lyon, Francombe, Hasdell, Lawson (1992, p.27), “rating the descriptors for the sensory characteristics of appearance, odour, flavour, texture and after-taste will generate what is often referred to as the sensory profile of the product”. Sensory profile was preferred due to its many advantages. It is the most sophisticated tool for the sensory scientist. It also provides complete sensory descriptions and it is used to quantify differences between products. Furthermore, sensory profile helps to determine which sensory attributes of the product, in this case taste, colour, smell and texture, are important to acceptance.
Descriptive analysis requires extensive panel training; it is time-consuming and requires precise and specific concepts articulated in carefully chosen scientific language.
Just Right Scale Test
To indicate the acceptance of sugar in the products, the just right scale was considered the most appropriate test. “Acceptance tests are used to evaluate product acceptability or to determine whether one or more products are more acceptable than others” (Lyon, Francombe, Hasdell, Lawson, 1992, p.31). Thus acceptability results from the interaction between the product and the consumer.
As Meilgaard, Civille and Carr (1991, p.217) pointed out, “the just-right scales allow the researcher to assess the intensity of an attribute relative to some mental criterion of the subjects”. The degree of sweetness of the two products was the attribute selected to determine consumer acceptance.
Thus, the just right scale measures the desirability of a specific attribute, and these scales are often used to determine the optimum levels of attributes in a product. In this scale, the intensity and hedonic judgements can be combined to provide directional information for product reformulation or optimisation. The just right was chosen because it is popular for the direct information that it can give on specific attributes to be optimised.
On the other hand, the panellists have to have a common idea or consensus understanding of the attribute in question. Obviously, this limits the just-right scale to few simple attributes that are widely understood, such as sweetness and saltiness.
Nine-point Hedonic Test
The nine-point hedonic test was the second test chosen to be undertaken, which belongs to the general class of acceptance or preference testing. This test was selected in order to find out which of the two product consumers prefer. The preference test forces a choice of one item over another, “preference is that expression of appeal of one product versus another” (Stone & Sidel, 1993, p.244).
The hedonic test occupies a unique niche for sensory evaluation and as Joung (1961) noted, the hedonic scale represents “the sight, intensity and temporal changes of affective processes” (Stone & Sidel, 1993, p.244). The panellists were asked it indicate the degree if liking for the products based on a nine-point scale, from extreme dislike to extreme like. This concerned the overall preference of the two products (Ribeena and Tesco blackcurrant squashes). The nine-point hedonic test is also known as a degree-of-liking scale. In this test, samples are served to panellists monadically (one at a time) and panellists are asked to indicate their hedonic response to the sample on the scale.
This test is the most useful sensory method for measuring product preference. The hedonic scale is also easily understood by all consumers, trained or not. Moreover, for sensory evaluation, the use of the nine-point hedonic scale is more informative. Hedonic rating can be easily affected by changes in environmental conditions, but usually the relative order of sample preference is not affected. As Maskowitz (1990) pointed out, “the nine-point hedonic scale has potential problems associated with category scales: the categories are not necessarily equally spaced, the neutral (‘neither like nor dislike’) category makes the scale less efficient, and consumers tend to avoid the extreme categories” (Lawless, Heymann, 1998, p.455).
4.3 ENVIRONMENTAL CONDITIONS
Environmental conditions refer to the temperature of the room, the state of noise or odours during the testing time and the general condition of the test room. “The ability of people to judge food is affected by distractions like noise, including talking, intrusive odours, exercise heat or cold or other discomfort, so it is important to rule these out as much as possible” (Lyon, Francombe, Hasdell,Lawson, 1992, p.4).
For more accurate results, the following criteria have been met:
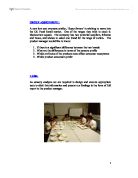
- Test took place in the sensory rooms of the university campus and at home, away from noise, odours and distraction.
- Two separated rooms where used: one for the sensory analysts where the samples were prepared and the other for the panellists where the samples were tested.
- The environment of the room was free of crowding and confusion as well as comfortable and quiet. This was due to the fact that panellists were advised in advance not to speak amongst them; so that there would be no negative impact on results of the test.
-
The temperature of the room was ideal, about 19oC so that panellist would feel comfortable while waiting and during test procedure.
- The lighting of the room was very good since there were day light-type fluorescent bulbs as well as windows on the one side of the kitchen.
4.4 SAMPLE PREPARATION
All four tests were performed in a period of two days. On the first day the triangle test and the just-right scale test were performed, whereas the descriptive analysis and the nine-point hedonic test were performed a week later. “More product can be assessed within a session when visual or tactile analyses are made than if the product has to be tasted or evaluated for odour. This is because the taste and odour senses are more easily fatigued” (Lyon, Francombe, Hasdell, Lawson, 1992, p.44).
The samples were prepared as follows:
Temperature
Total amount used
- Tesco 800ml
- Ribeena 1000ml
- Bottled water 9000ml
Proportion (amount in each glass)
- 10ml of squash equal to 50ml of water
Preparation time
- Triangle Test and Just-right Scale Test: 40 minutes
- Descriptive Analysis and Nine-point Hedonic Scale: 30 minutes
4.5 SAMPLE PRESENTATION
Squashes were presented in identical white plastic disposable containers for all the four tests, and 20 panellists, in each case, were asked to test them. The samples were equally served. Every offered glass contained 10ml of squash and 50ml of water. Moreover, both samples were presented in the same form, consistency and colour to prevent tester being distracted by irrelevant factors. A glass of water was also offered and the samples were evaluated from left to right, in a combination of random and balanced order.
Triangle Test
In this test, three samples were presented, two were alike and one was different. The three samples were coded with numbers 315, 579, 731. Numbers 315 and 731 represented Ribeena squash, whilst number 579 represented Tesco.
Panellists did not know the code of each squash. They were therefore given a questionnaire asking them to circle the odd sample (Appendix 1).
Samples could have been re-tasted if a choice could not have been made.
Descriptive Analysis Test
Panellists were asked to illustrate the feelings of the taste, colour, smell and texture of the two products. Ribeena was coded, as X and Tesco as Y, without letting the panellists know the coded representation. Each product had its own questionnaire, which involved the above four attributes (Appendix 3). Moreover, a glass of water was offered to avoid the mixing of the tastes.
Just-right Scale Test
Ribeena and Tesco squashes were coded as X and Y respectively and panellists were asked to indicate in the two questionnaire given (one for each sample), the acceptance of sugar product (Appendix 2). The codes were once more unknown to the panellists. A glass of water was also given to avoid the mixing of the tastes.
Nine-point Hedonic Test
For this test, products were again coded secretly from the panellists. Ribeena, was X and Tesco was Y. A questionnaire was given for each product (see Appendix 4) and panellists were asked to indicate their degree of linking for each product based or a nine-point scale. A glass of water was offered between the two products.
4.6 PANEL SELECTION AND TRAINING
Panel is the group of people that comprise a test population chosen for specific characteristics. “Panel of expert examiners is a group of 10 to 20 people trained and induced to the olfactory and/or gustatory evaluation at the time of tasting session of products’’ (www.google.co.uk). Panellists are very important participants in a sensory evaluation and they are characterised by their objectivity, precision and reproductively.
“Some incentive to participate in a sensory study is usually necessary in order to motivate people to volunteer. Sensory specialists should not expect automatic agreement of a person asked to be on a panel, and should be realistic about the benefits for the person. ‘What’s in it for me?’ is a reasonable question that sensory panel leaders should be ready to answer” (Lawless, Heymann, 1998, p.107).
As sensory analysts, we considered it important to ask the panellists questions at each point about the worst possible scenario and how the study could be improved to minimise any contingencies.
In case the panel selection failed to the above criteria the sensory evaluation process would fail to meet the appropriate results.
4.7 DATA COLLECTION
The basic types of scaling method are four. They are commonly referred to nominal, ordinal, interval and ratio. As Lyon, Francombe, Hasdell and Lawson (1992, p.20) pointed out, “it is important that the sensory analyst understands the meaning of these, as this will affect the nature of the data”.
A nominal scale is one where data are categorised by name or number, which acts as a label. Each observation collected must fall within one of the categories, which have no logical ordering.
An ordinal scale is one, which allows observations to be ordered according to whether they have more or less of a particular attribute. Such scales are represented by numbers, where the lowest number usually denotes ‘less of’ and highest number denotes ‘more of’. Ordinal scales do not allow quantification of the amount of difference between observations.
An interval scale is one where the distances or intervals between points on the distances ore intervals between points on the scale are assumed to be equal.
A ratio scale is one on which numbers can be expressed as ratios of each other.
Two of these scales were used in this evaluation: nominal and ordinal. The first test used, triangle test, is nominal since numbers that act as a label categorizes data. Numbers 315 and 713 represented Ribenna squash and number 597 Tesco squash. Although the three categories had no logical ordering, the results would not be affected or biased.
In contrast, the three other tests used, just right scale test descriptive analysis test and nine-point hedonic test are ordinal. Just right scale test in ordinal because it involves ordered observations about the degree of acceptance of sugar. Descriptive analysis test is again ordinal since numbers represents the attributes, where the lowest number denotes “less of” and the highest number denotes “more of”. Furthermore, the nine-point hedonic test is ordinal, as it ranked data.
4.8 DATA ANALYSIS
After the data was collected, it was considered necessary to be analysed. “The statistical tools used to analyse the data will depend on the nature of the test, and the type of analysis tool will determine the type and nature of the information derived from the data ”(Lyon, Francombe, Hasdell, Lawson 1991 p.23). Data was analyses with the help of Microsoft Excel and SPSS.
Microsoft Excel is one of the most popular application programs available in the market and it belongs in the family of spreadsheets. A spreadsheet is defined as the electronic equivalent of an accountant ledger. Data is usually displayed on graphs. Also spreadsheets can display numeric data using different types of graphs, such as line charts, pie charts, etc. Triangle test was analysed using Microsoft excel. The numeric data was displayed using a line chart and pie chart. On the line chart, the data of the number of panellists who scored the correct answer and the number of panellist who did not were displayed. On the pie chart, the percentage of the panellist who scored or did not score the correct answer whereas only three tests was displayed on line charts, so as to show the comparison between the two brands.
SPSS was the second statistical analysis tool used. It provides statistics and graphical displays that are useful for describing many types of variables. “ A very common and useful test in sensory evaluation it to examine whether the means from two small groups of observations (e.g. two products or two different panels) are statistically different or whether we can conclude that they are about the same. (Lawless, Heymann, 1998 p.667). This is tested using the t-test, but only paired t-test was used, since observations are paired. Paired t-test or dependent t-test was performed for the just –right scale test, the descriptive analysis test and the nine point hedonic test.
4.9 DATA INTERPRETATION
As in every evaluation, results have to be interpreted. In order to achieve that, a null and an alternative hypothesis were set.
In the triangle test the null hypothesis stated that there is no difference between the two samples, i.e. more panellists found the correct answer, whilst the alternative stated that there is a difference between the samples, i.e. panellist could not find the correct answer. If the number of correct answers were bigger, the null hypothesis would not be rejected.
In the descriptive analysis test, the just-right scale test and the nine –point hedonic test, a null and an alternative hypothesis were again set. The null hypothesis stated that there is difference between the two samples and the alternative hypothesis stated that there is difference between the two products. The level of significance used was set at 5% -5% margin of error and 95% confidence interval. If the p-value was found being lower than 0.05 then it accepted and there would then be difference between the two brands. If, on the other hand the p-value was found to be equal or higher than 0,05 then the null hypothesis was rejected, i.e. there was no difference between the two squashes.
5. DISCUSSION
To start with, in the null hypothesis of the triangle test stated that there is a difference between Ribeena and Tesco blackcurrant squashes. The null hypothesis was not rejected as 17 panellists found the correct answer (579 which was Ribeena squash). From the results we say that there is a difference between the two brands. The statistical analysis software used to interpret the results was Excel.
In the line chart below the answers of the panellists can be seen:
The graph shows more clearly the panellists answers about the three samples. The sample no.579 was the Ribeena squash and and 17 of the panellists found it correct.
In this pie chart , the answer of the panellist can be seen as a percentage:
The 85% of the panellists team answers that the samlpe no.579 was Ribeena squash.
The second test, descriptive analysis is very important test in sensory evaluation. This test is divided into four categories, taste, colour, smell and texture. To the panel group a questionnaire was given and they should evaluate there evaluation from 1-5 (see appendix questionnaires-taste).
The null hypothesis on taste was not rejected, as the result was 0,00 (see appendix) this number is less than the significance level of 0,05 , meaning that there is a difference between Ribeena and Tesco squashes. The mean number shows that Ribeena squash was not as sweet as Tesco squash . This can be seen more easily in the graph below:
In addition the null hypothesis on colour stated that there is a difference between the two products. The null hypothesis is rejected, since that the result was 0,000 (see appendix ), which shows that there is a significant difference between the two squashes. In graph below, it can be seen that the panellists agree that Ribeena squash has a darker colour than Tesco squash:
To continue with, the null hypothesis for smell stated that there is difference between Ribeena and Tesco squashes. The result was 0,01 (see appendix), which is smaller than 0,05. That means that the null hypothesis is accept as 0.01 is smaller than 0,05 and we say that there is difference on smell between Ribeena and Tesco squashes. It can also seen from the graph that there is no difference, since the means are very next to each other:
The null hypothesis of textures stated that there is no difference between the two squashes. The result was 0,00 (see appendix) which is lower than 0,05. This shows that the null hypothesis of texture is rejected and that there is a difference between Ribeena and Tesco blackcurrant squashes. As it can be seen from the graph, more panellists found that the texture of Ribeena is more pleasant than Tesco:
In the just-right scale test the null hypothesis stated that there is a difference between the two samples. The t-test was 0,00 (see appendix), which is smaller than the 0,05. Thus, we say that the null hypothesis is not rejected and that there is a difference between the two products. In the graphs shown below, it can be seen that Ribeena squash is being sweeter than Tesco
To continue with, the fourth test is nine-point hedonic scale test. The null hypothesis stated that there is a difference between the Ribeena and Tesco squashes. The results from this test were 0,01 (see appendix) which is smaller than 0,05. The null hypothesis was rejected that there is a difference between the two products. Tesco blackcurrant squash is found as having a mean of 3,97 (near to 4 thus it is liked slightly) and Ribeena as having mean of 4.94 (that is neither liked nor disliked). This can be seen more easily below:
As it was mentioned before the panels where untrained since they were students. It is not true that if the panels were trained, the results would be more reliable, because “even with the best training the panel may occasionally ‘go out of control’” (Amerine, Pangborn, Reryam, Pilgrim, 1965, p.296)
However, for more reliable results, a greater of number of untrained panels could have tried the test. This is due to the fact that “an untrained panel is not as sensitive to small difference as a trained panel, and therefore the size of untrained panel should be much larger than a trained panel” (Lyon, Francombe, Hasdell, Lawson, 1992, p.27).
Furthermore, the test were carried out in two days. On the first the triangle test and the just-right scale test were performed, whereas, the descriptive analysis test and the nine-point hedonic test were performed a week later. This was very helpful to the procedure because the panellists did not confused.
6. RECOMMENDATIONS
In order for the report to be more reliable the following things should be taken into consideration:
- The number of panellists should increase, as the panellists are untrained.
- Smoking, eating, drinking and wearing perfumes should be avoided for more unbiased results.
- Information should be given on panellists regarding the procedure of the tests such as how they should complete the questionnaires and things in general should be made easier to be understood.
- Create the best possible environment.
- Questions should be asked to panellists at each point about the worst possible scenario and how the study could be improved to minimize these contingencies.
7. CONCLUSION
It is evident that sensory evaluation represents a different type of challenge for marketers, for scientists and technologists. “This challenge is more obvious when test results are used for determining project accountability or as a measure of a requester’s performance” (Stone & Sidel, 1993, p.311).
In triangle test, just-right scale test, nine-point hedonic scale test and in the three attributes of descriptive analysis test, taste, colour and texture, the null hypothesis was not rejected and there was found to be a difference between the two products. In the attributed of descriptive analysis test smell the null hypothesis was rejected, meaning that there was no any difference found between the two brands according to smell.
Based on the result found, Ribeena squash was preferred by most panellists. Thus the “super savers ”may choose the Ribeena squash. On the other hand, further testing would make the results more accurate and the recommendations of this report would be studied before the other evaluation, for the results not to be biased.
BIBLIOGRAPHY:
-
AMERINE M., PANGBORN & ROESSLER E. (1965), Principles of Sensory Evaluation of Food, American Academy Press
-
LAWLESS H.T & HEYMANN H. (1998), Sensory evaluation of Food: Principles and Practices, New York: Chapman & Hall
-
LYON D.H., FRANCOMBE M.A, HASDELL T.A. & LAWSON K. (1992), Guidelines for sensory Analysis in Food Product development and Quality control, London: Chapman & Hall
-
MEIGAARD M, CIVILLE G.V. & CARR T.B. (1991), Sensory evaluation Techniques, 2nd ed., Florida: CRC Press LCC
-
STONE H. & SIDEL J. (1992), Sensory evaluation Practices, 2ND ed, California : Academic Press Inc.
- www.google.co.uk