C3 Coursework - different methods of solving equations.
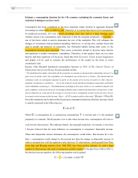
C3 Coursework - Numerical Solutions Decimal Search There a numerous ways to solve a problem and in finding the unknown. Some methods give you the exact and precise answer but usually are harder and more complex. The Decimal search method enables you to get a very close approximate to the real solution but more easily. The way this method works is by looking between two numerical values (for example 1 and 2) and then As a demonstration in applying this method, I will be attempting to solve this equation using the Decimal Search method and going through the method step by step: Below is what this function looks when plotted on a graph: We know that the solution for F(x) = 0 is the point on the X axis where the sign changes from a positive to a negative. So if we zoom in a little bit further, from this graph we can tell where the solution lies, somewhere between 0 and 10 Now that we know the solution is roughly between these two values, I will use excel to solve the problem with firstly taking increments in x, the size of 1. So when I substitute the incremented values of x between -10 and 0 into the equation, I get the following results: x F(x) -1 20 -2 9 -3 0 -4 -13 -5 -56 -6 -125 -7 -226 -8 -365 -9 -548 You can tell that the sign changed between -3 and -4. So I set these as my initial values. The fact that the solution lies between -3 and -4 can
Numerical solutions of equations
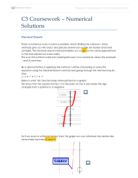
A2 Mathematics Coursework C3 Year 12 Numerical solutions of equations Solving 0 = x5+x-5 using the "Change Of Sign" Method The method I will use to solve 0 = x5+x-5 is the Change of Sign Method involving the Decimal Search method. I have drawn this graph using the Autograph Software, and the print screen of this is below: From my graph above, I can see that the root of this equation is between x =1 and x = 1.5. The table of x values and f(x) values is shown below. I can work out the f(x) values by substituting the x-values into the equation. x .1 .2 .3 .4 .5 f(x) -3 -2.28949 -1.31168 0.01293 .77824 4.09375 From my table of values above, it is clear that the change of sign from negative to positive occurs between x = 1.2 and x = 1.3. So, I can narrow these values down further to find another change of sign. x f(x) .21 -1.19626 .22 -1.07729 .23 -0.95469 .24 -0.82837 .25 -0.69824 .26 -0.56420 .27 -0.42616 .28 -0.28403 .29 -0.13769 .30 0.01293 I can see that the change of sign is between x = 1.29 and x = 1.30. x f(x) .291 -0.12283 .292 -0.10792 .293 -0.09296 .294 -0.07797 .295 -0.06293 .296 -0.04784 .297 -0.03271 .298 -0.01754 .299 -0.00233 .300 0.01293 The change of sign is in the interval [1.299, 1.300] x f(x) .2991 -0.000805 .2992 0.000720 .2993 0.002244 The root of this equation lies in the interval

The Gradient Function
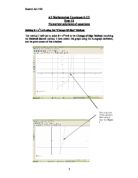
The Gradient Function Aim: To find the gradient function of curves of the form y=axn. To begin with, I should investigate how the gradient changes, in relation to the value of x. Following this, I plan to expand my investigation to see how the gradient changes, and as a result how a changes in relation to this. Method: At the very start of the investigation, I shall investigate the gradient at the values of y=xn. To start with, I shall put the results in a table, but later on, as I attempt to find the gradient through advanced methods, a table may be unnecessary. As I plot the values of y=x2, this should allow me to plot a line of best fit and analyze, and otherwise evaluate, the relationship between the gradient and x in this equation. I have begun with n=2. After analyzing this, I shall carry on using a constant value of "a" until further on in the investigation, and keep on increasing n by 1 each time. I shall plot on the graphs the relative x values and determine a gradient between n and the gradients. Perhaps further on in the investigation, I shall modify the value of a, and perhaps make n a fractional or negative power. Method to find the gradient: These methods would perhaps be better if I demonstrated them using an example, so I will illustrate this using y=x2. This is the graph of y=x2. I will find out the gradient of this curve, by using the three methods -