Critical Path Analysis
When choosing a project for this piece of coursework it was important to find something that was both original and capable of meeting the coursework criteria. However, after some research into possible projects, I decided on web design. Web design is happening all over the world at current due to the increasing demand for online presence and business prospect. Most companies wanting to add a website to their business would be happy to pay out large sums of money to a web design firm that may not be meeting client deadlines in the most optimal time. Therefore, my project is aimed at a large scale website design project, trying to find the minimal time in which a website can be completed in. If successful, this project could be used by a wide range of web businesses, capable of enhancing time management and resource control, thus savings money.
One problem that I faced, almost straight away, was that websites come in many shapes and sizes. Therefore I had to narrow down the kind of site that I was working with. So, based on a web project that I recently read about, I set out to complete modeling for a 2-tier (public and members) web site, capable of offering subscriptions to users so that they could access a 'member-only' section. This involved a lot more that just a standard website as a business would have to implement different modules of programming to perform certain tasks both on the server and client-side system. In short, the project involved lots of activities that needed to be completed.
Precedence Table:
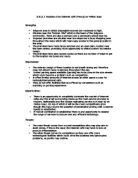
Once I had researched what activities my project entailed, I set out to find how long each activity would take, and how many team-members would be needed to complete each activity efficiently. For this, I went and spoke with a web administrator at PCS (Portcullis House) in Southend. After having spoken with PCS, I finalized a 26-activity project, with durations and team-members, for which I created a precedence table. This table shows the label for the activity, a description of the activity, its duration, which activities need to be completed for the next to be carried out (preceding activity), and finally the number of workers for each activity. The precedence table is shown in figure 1.1. From this we can see the complexity of the website being designed.
Activity Network:
From the precedence table it was possible to produce an activity network which shows how each activity is relative to the next. Not only does this show which activities are dependant on each other, but it gives a clear layout of the project activities. Due to the many possibilities of layout when designing an activity network, it took several attempts to find a reasonable activity network layout. One such attempt is seen in figure 1.0, eventually being transformed in the final layout seen in figure 1.2.
Dummies:
Dummies have been used to ...
This is a preview of the whole essay
Activity Network:
From the precedence table it was possible to produce an activity network which shows how each activity is relative to the next. Not only does this show which activities are dependant on each other, but it gives a clear layout of the project activities. Due to the many possibilities of layout when designing an activity network, it took several attempts to find a reasonable activity network layout. One such attempt is seen in figure 1.0, eventually being transformed in the final layout seen in figure 1.2.
Dummies:
Dummies have been used to connect precedence activities to a dependant activity. They are denoted by dashed lines (with the direction of flow being shown).
Forward & Backward Pass:
The forward and backward pass is where the activity durations come into the activity network. They allow the plan to evaluate durations of the overall project. The forward and backward passes are shown in a rectangle box by each node in the activity network. The forward pass is a steadily increasing value which shows the earliest times an activity can be completed in, whereas the backward pass shows the latest time which an activity can be completed in.
Once the forward and backward pass had been added into the network, it was plain to see that the shortest time in which the project could be completed in was 30 weeks.
Float:
Additionally, the forward and backward pass allows us to see that some activities have extra time to be completed in. That is, they can be started at a later time and still meet the project schedule. After having drawn out the activity network and added in the forward and backward pass, it became apparent that there were activities which had floats. These were calculated, and noted. Finding the float required the use of three basic formulas, these were the 'total float', 'independent float', and 'interfering float'. The total float is calculated by the following:
{latest time at 2nd node) - (earliest time at 1st node) - {duration of activity}
This type of float was used throughout the project. It enables us to see how much the activity can be delayed or increased if it is stand-alone. The other two types of float can be found by using the following formulas:
* Independent Float:
{earliest time at 2nd node} - {latest time at 1st node} - {duration of activity}
* Interfering Float:
{total float} - {independent float}
Critical Path:
Now that a full activity network had been completed, it was possible to see the critical activity path, defined by activities which had no float. The critical path is a certain number of activities that simply must be completed in their defined time, with no exception. If these activities were not to be completed in the given time, the project would run late, thus affecting every subsequent activity. In figure 1.2 the critical path has been highlighted.
Cascade (Gantt) Charts:
Once the full activity network had been completed, it was much easier to see the activities and floats (if applicable), by them being laid out in a clear diagram. This was done by using a cascade chart, which sets out each activity down the page, allowing us to see which activities start and finish each week, as well as being able to see project progress. The cascade chart seen in figure 1.3 shows the critical and non-critical activities clearly colored.
Resource Histogram:
The resource histogram takes information regarding the number of workers per activity, and plots a graph to show this information. It allows us to see the minimum and maximum resources (in this case, workers) in use over the project. Based upon the histogram in figure 1.4, it can be seen that the minimum resources is 1 (week 21), and the maximum is 9 (weeks 5 & 6).
Primary Evaluations:
Now that all the data has been collected and charts have been drawn out, it's plain to see that there is a fixed critical path that can not be amended to decrease the project completion time. However, I intend to improve resources such that the maximum resource level is lowered, and if possible the minimum is raised, to create a more even resource level across the project.
Resource Leveling:
The first thing that needed to be looked at when setting out to improve resource leveling was the resource histogram. From this, figure 1.4, it was clear that the first 8 weeks of the project included the highest amount of resources. Then looking back at figure 1.3, the cascade chart, it was possible to note the high level of floats in many activities. This made it possible to delay completion of certain activities (with float), to not only lower resources levels during certain weeks, but increase levels in later weeks.
I decided on delaying activities C, D and L. C was delayed 10 weeks, D was delayed 14 weeks and L was delayed 13 weeks from their original positions.
From this, new cascade charts and histograms were produced, showing the new positions of activities that were moved (see figure 1.5), as well as showing the new resource levels (see figure 1.6).
Secondary Evaluation:
From figure 1.6 it is now possible to see how the resources have been leveled to reveal that the maximum number of resources is now 6. This new level means that a company producing the web site will not have large numbers of staff working on the project at once. This means less computers will be in use over the project (as nearly every activity requires the use of a computer), thus saving money. It also means that a company with only 6 computers can complete this project in the same time scale. Previously, it would have required 9 computers (one for each worker). A company with less than 6 computers may struggle meeting the overall project deadline, therefore the resources stated in this project require additional equipment relative to each resource. Without this, the project is in danger of taking longer.
Refinement:
One possible refinement that occurred to me was that if the activities were broken down into sub-categories, would it produce better results? However, now that the critical path had been established, creating sub-activities would only break the critical path up more. So it wouldn't improve overall project time. What it may do though, is create improvements in resource-leveling, as the smaller activities could be rearranged to begin on single weeks that have lower resources (such as week 21).
It is possible that there is an element of error in my research, such that there may be deviation of around half a day for each activity (thus creating an error margin of around 2-3 weeks). This of course may produce different results to that planned. However, it would be interesting to complete a project similar to the one stated, to see just how my evaluation responds.
Maths - Coursework - Critical Path Analysis
By Tim Durden - Nov 2003