Apparatus:
Quadrat (1m x 1m)
Tape measure
100m rope for interrupted belt transect
Wellington boots
Waterproofs
Gloves
Results Tables
Stones for weights (if windy)
Method:
- Gather all apparatus.
- Lay 100m rope along the beach of the lower shore, and weigh down with stones if necessary.
- Place quadrat so that the bottom edge touches the rope, at one of its ends.
- Estimate using the ACFOR scale the overall cover of the quadrat by all species including rock.
- Count any Fucus vesiculosus that are entirely inside the quadrat. Also count any that touch the top or left edges of the quadrat, if they are partially outside the quadrat. Do not count any Fucus vesiculosus whose roots are outside the quadrat or are partially outside the quadrat and do not touch the top or left edges. The first five Fucus vesiculosus counted in each quadrat will be part of the sample.
- For each of the Fucus vesiculosus in your sample, measure the longest frond with a tape measure from root to tip. You will identify the longest frond by running your fingers from the plant’s roots, to the point on the plant furthest away from the roots. Also count the number of bladders, recording the information in a results table as shown.
- Using a tape measure to measure, repeat steps 3-6 every 2 metres along the belt transect (100m rope), so that in total you’ve placed 50 quadrats over the 100m transect.
- Repeat method on the middle shore, recording the data in tables, as you work.
Examples of the tables are shown below:
To record ACFOR coverage on each area of the shore;
To record length of frond and number of bladders on each area of the shore;
Justification: Apparatus:
I have opted to sample the Fucus vesiculosus using an interrupted belt transect 100m in length, taking samples at 2m intervals. This is as, using a shorter transect or larger intervals, would make my sample less representative of the area being sampled, and so my results would lack reliability. However, if I was to use a transect of a longer length, the transect may start to enter different shore zones. For example, a longer transect at lower shore may result in part of the middle shore being sampled. Using a longer transect, or a continuous belt transect of the same length would also be incredible time consuming, and so not ideal.
I have decided to use a 1m x 1m quadrat as Fucus vesiculosus can grow up to 2m long, and at the time when I’m executing my investigation, it’s likely that the seaweed will be at it’s maximum length. In light of this fact I felt that a smaller quadrat would cause me to have too small a sample. Conversely, a larger quadrat would mean I’d have to take a larger sample for it to be representative, which would be too time-consuming to do.
I have chosen to use a tape measure to measure the lengths of the longest fronds. This is to limit the margin of error available whilst carrying out my experiment. The tape measure will be able to measure to an accuracy of 0.001m. If a smaller degree of accuracy was used, it’s possible that very large errors could be made. I am unable to use a greater degree of accuracy due to the limitations of the range of equipment available to me. However, by using this degree of accuracy I am limiting the maximum error in my measurements to 0.005m, which I feel is an acceptable maximum error.
Justification: Method:
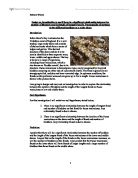
I have decided to sample the Fucus vesiculosus from the lower and middle shores of Robin Hood’s Bay. My reason for choosing to sample from these areas is that I believe there will be an abundance of Fucus vesiculosus in each of these spaces, due to the conditions. The upper shore is exposed for the longest period of time of the three shores. Due to this, Fucus vesiculosus find it hard to survive on the upper shore, as they are exposed to the wind and humidity for large durations of time, causing desiccation to occur. Therefore, I would not expect to find many Fucus vesiculosus plants on the upper shore and thus I have opted not to sample it.
I am using a form of systematic sampling in my investigation in order to obtain a representative sample. Random sampling would have given me a sample just as representative, however this method of sampling did not appeal to me as much as systematic sampling did for a number of reasons. Firstly, random sampling would involve mapping out a grid and then generating random numbers. I felt that this would be difficult to do, as the shelved structure of the bay would mean a grid would inevitably incorporate the ledges and gullies caused by this shelved structure. However, a line transect would avoid these gullies. Secondly, systematic sampling appealed to me above random sampling, due to the time restrictions imposed on me on the day of execution. The tide is known to move in very quickly due to the shelved nature of the bay, so I feel there would not be time to map out a grid and sample from it on the lower shore before it is covered by the tide.
I have also opted to sample the lower shore before the middle shore. This is due to the fact that the tide moves in quickly, and so by starting closest to the sea and working away from it, I am ensuring that I am working in the safest conditions possible.
I have opted to use a belt transect that runs up the shore as opposed to across the shore. Placing the transect across the shore poses dangers, as the transect would inevitably incorporate deep gullies, that can reach up to 10ft deep. These gullies are avoided if the transect is running up the shore, thus I have chosen to have the transect running up the shore.
In my plan I stated to only count the number of bladders on the longest frond of each Fucus vesiculosus. This is as it will allow me to see if there is a direct relationship between the number of bladders and the length of frond that these bladders are on. Using this method means I don’t have to consider the number of bladders on the entire alga, which will consequently save me time, and potential confusion in counting large numbers of bladders on seaweed. I have decided to include the number of popped or damaged bladders on the longest frond as well as the undamaged bladders. This is because essentially, I am investigating the number of bladders produced by the Fucus vesiculosus, and the relationship between this and its environment.
I have stated in my plan that I am going to use the ACFOR scale to estimate the overall coverage of the quadrats. The ACFOR scale is a process in which each species in the quadrat is recorded as being Abundant (A), common (C), frequent (F), occasional (O), or rare (R). The alternative to the ACFOR scale is to use percentage cover method, in which you must estimate the percentage of the area inside the quadrat that is occupied by each species. I opted to use the ACFOR scale method over the percentage cover method, as I felt that to estimate the percentage cover would be time consuming, and leaves a large margin for error, whereas decisions based on the ACFOR scale can be made quickly. The reason why I am using the ACFOR method is so that I can compare the distribution of seaweeds in the two different locations, taking the competition into consideration. These factors will influence the frond lengths of the Fucus vesiculosus.
In my method, I stated that if seaweed lies only partially inside the quadrat they should only be counted if their roots are inside the quadrat and they touch the top or left edges of the quadrat. I have chosen to do this to ensure that my investigation is fair, and that every quadrat is sampled in the same way. This will add reliability to my results.
I am carrying out my investigation in September, at the end of summer. This is due to the fact that the Fucus vesiculosus will have experienced the optimum conditions for growth over the summer, so there should be an abundance of thriving Fucus vesiculosus at this time of year. As well as having experienced the optimum conditions over the summer months, genetic variation within the species should also mean that the Fucus Vesiculosus are best adapted to live on the shore, and therefore they should be thriving. Genetic variation is caused by mutations in certain of the seaweeds’ genes, which are passed on to the offspring during reproduction. If this mutated gene then produces a characteristic that is favourable to the seaweed for survival, the algae with these characteristics will thrive and intraspecific competition between the Fucus Vesiculosus will cause the seaweed with this new adaptation to compete with the genetically unchanged seaweed, consequently causing the algae lacking this favourable gene to die out. An example of an adaptation of the Fucus Vesiculosus species of seaweed would be that they have an oily surface. This is to reduce the rate of transpiration and consequently to prevent the algae from desiccation when uncovered by the sea. Only a small number of the species would have possessed this characteristic at one point, but since it has proved to be favourable to the Fucus Vesiculosus species, the algae that had the gene coding for an oily surface thrived, reproduced and consequently meant that algae without this gene could not compete with the seaweed with this adaptation. This is an example of Survival of the Fittest in the natural environment. In addition, by conducting the investigation at this time of year I am also putting myself in the least amount of danger, as carrying out the investigation in winter would possibly bring treacherous weather conditions and more dangerous tidal movements due to lunar position.
Precautions:
The prominent safety issue posed by this investigation is the fact that the tide at Robin Hood’s Bay is known to move up the sea shore at a quick rate, and that deep gullies mean that when the tide comes in it is easy to get cut off from the main shore. To ensure my own safety, I must closely observe the tide throughout the execution of my investigation, to make sure that I complete my data collection in good time, well before the tide comes in. Due to this danger it is also essential that I sample from the lower shore before the middle shore, in order to give the tide as little chance as possible of putting me in danger.
It is important to be careful when treading on the seaweed as Fucus vesiculosus is known to have an oily coat in order to lower it’s transpiration rate. This causes the seaweed to be slippery, which is why care should be taken when standing on it.
Abiotic Factors:
Whilst I conduct my investigation at Robin Hood’s Bay there are a number of abiotic factors to take into account, as they will affect where and how the Fucus vesiculosus grows.
The salinity of the sea may affect the growth rate of the algae, due to the effect it will have on the difference in water potential between the sea and inside the alga. This factor may vary throughout the year. For example, salt content will be relatively low after heavy rainfall. This will cause the rate of photosynthesis to increase, as the water potential of the sea will be less negative than that inside the algae, causing water to diffuse into cells of the seaweed, ready for photosynthesis. Conversely, salinity will be high during hot weather when water will be evaporated. This will cause the rate of photosynthesis to decrease, as due to the water potential of the sea being potentially more negative than that inside the algae, the water will diffuse out of the algae by osmosis, meaning there is less water retained for photosynthesis inside the cells of the algae. Although this factor will vary throughout the year, it will not vary between the two locations on the shore, and so will not be a vital factor to consider in my investigation.
Another factor that may have an affect on how the algae grow is water availability, which is effected by the salt content of the sea, due to water potential. The algae need water in order to respire. Lack of water can result in desiccation and consequent death. This is another factor that will vary throughout the year, yet should be the same on the lower and middle shore, so is not a pivotal factor to consider.
The temperature is an abiotic factor that will have an effect on this investigation, as it will vary between the two different locations. When the seaweed is covered by the sea its temperature will drop as it has a higher specific heat capacity than air. Fucus vesiculosus at the lower shore will be at a lower temperature for the longest period of time, as it is covered by the sea for the longest length of time. This may affect the lengths that the fronds grow to, and hence the number of bladders that they contain. Therefore, I will be aware of the temperature difference when analysing my results, and drawing conclusions.
As I have previously stated, wind and humidity are factors that should be considered when conducting my investigation and analysing my results. This is as the seaweed on the middle shore will be exposed to these factors for a longer period of time than the Fucus vesiculosus on the lower shore. These factors cause desiccation and affect the rate of transpiration, and so may affect the distribution of seaweed on the shoreline.
Other variable factors at Robin Hood’s Bay are oxygen/carbon dioxide availability, pH and mineral availability. These are all factors that I cannot control, however I will consider them when analysing my results and drawing conclusions.
Wave activity will also affect the growth of the Fucus Vesiculosus. Due to wave activity, Fucus Vesiculosus plants are strongly attached to the rock or seabed on which they grow by a holdfast or disc. If wave activity is vigorous, bladders may be damaged. This may cause the rate of photosynthesis and therefore the growth rate to be inhibited, as fewer bladders on a Fucus Vesiculosus plant will mean that it has less buoyancy, and therefore will be further away from the sun, under water. This will restrict the rate of absorption of light energy, due to the fact that light travels slower through water. Seaweed with damaged bladders will be less inhibited on the middle shore, due to the depth of the water being less than that on the lower shore, therefore, it maybe an aspect to take into account when interpreting and analysing my results.
Limitations:
Several limitations are apparent in this investigation. Most of them due to the time restrictions imposed on me by the quick moving tide. For example, the number of samples taken has to be limited due to the time available. It would be advantageous to take a larger sample, as it would be more representative, and therefore would give more reliable results. However, although the reliability of my results could be improved upon by taking a larger sample, I feel that the sample size that I plan to take will give me results reliable enough to trust.
The limitations of the equipment that I have access to also means that my results may not be as accurate as they would be if more precise equipment was used. For example, I am only measuring the lengths of the fronds accurately to the nearest mm. If I measured to a greater degree of accuracy, my results would become more reliable; however I am limited by the range of equipment available to me. I do feel that this degree of accuracy is sufficient in this location however, as the results are being used mainly to compare two locations, and so as long as the degree of accuracy id consistent between the two locations, no there will be no great flaw in my investigation.
Graphs:
Once my data has been collected I am going to construct a number of graphs in order to make the data easy to interpret and analyse. The first graph I have chosen to plot is length of longest frond against number of bladders on that frond. I will plot this graph, in the form of a scatter diagram, including the data from both shores. I will study the graph to see if there is a correlation, a correlation being relationship or direct link between the variables. A positive correlation is an increase in one variable is accompanied by an increase in the other. This is what I expect my graph to show. Negative correlation is when an increase in one variable is accompanied by a decrease in the other. If a correlation exists then it means that one variable has an effect on the other.
Having plotted this graph I am then going to plot two bar graphs on separate sets of axes. On these graphs I will plot the lengths of the longest fronds of Fucus vesiculosus, against the frequency of the seaweed for each length, for each shore, to consequently discover if there is an obvious difference in the distribution of heights for each of the locations.
These graphs can then be compared and any trends should be easily spotted. By this point I expect that I will have established that there is a relationship between the length of the longest frond and the number of bladders, so I feel it would be unnecessary to plot the above graph for number of bladders as well as length of longest frond. However, if my results are not as I expected and a strong relationship is not shown between length of longest frond and number of bladders, I may plot the graph of frequency of Fucus vesiculosus against number of bladders, in order to analyse my results further:
I am then going to plot, on separate line graphs, the relative abundance of different components found in quadrats layered on the lower shore and middle shore. I’ll provide a key so that the different species are distinguishable on the graphs. This will enable me to consider the competition whilst interpreting my results, and aid me in justifying the distribution of Fucus Vesiculosus on both shores. Below is an example of the distribution I expect my
Statistical Tests:
To test my null hypotheses I am going to conduct a number of statistical tests. The first of these will be the student t-test. I am going to use this test to see if there is a significant relationship between the location of the Fucus vesiculosus and the length of its longest frond. The reason I have chosen to use this statistical test instead of the chi-squared test this time, is that the X2 test is usually used to discover if there is a significant relationship between things that have been counted, such as the bladders, rather than measured. The t-test is commonly used to compare the means and standard deviations of two populations where we take measurements (i.e. lengths), rather than count. The t-test compares populations whose distribution curves overlap, as shown below:
As such we assume that the population follows normal distribution. The same number of data isn’t required for both groups. The t-test will help me to determine if there is a significant difference between the means and standard deviations of the two populations, as the chi-squared test will for the means and standard deviations of the number of bladders.
The equation for the t-test is:
X1 = mean of population one
X2 = mean of population two
θ1 = standard deviation of population one
θ2 = standard deviation of population two
n = number of measurements in each case
I will be using Excel, a computer programme, to execute the student t-test. Firstly, the means of each set of data will be calculated by summing up the results from each location separately, then dividing by the number of samples taken in that location.
The standard deviation will then be calculated using the following formula;
The numbers are then placed in to the formula for the t-test, the degree of freedom is calculated, which in this case is the sum of measurements from both locations, minus 2. Again I will choose to use the 5% probability, read off the tabulated value, and compare that calculated with the tabulated one. Once again, if my calculated value is greater than the tabulated value, I will reject my null hypothesis.
The second statistical test I will carry out is Pearson’s correlation. I’ll conduct this side by side with my scatter graph of length of longest frond and number of bladders for both shores. This way my result for Pearson’s correlation will support my graph, and hopefully prove my null hypothesis to be incorrect. Calculating the correlation will provide an index to the degree to which two variables are related- correlation coefficient (r).
If r is +1 (perfect positive)
-1 (perfect negative)
0 is no correlation
Pearson’s is the test that that I will use to calculate r. This uses actual values as opposed to Spearman Rank Correlation Coefficient which uses ranked raw data. As a result, Pearson’s is more suitable in this situation.
Finally I will see if there is a different between the distributions of Fucus vesiculosus on the two shores. I will also see if there is a large amount of bare rock and other species of seaweed at the two locations. By analysing these facts I can see which shore is more competitive and I will take this factor into account whilst analysing my results. I will also see if the distribution of Fucus vesiculosus varies as I move up the shores. This will allow me to observe any graduations in the habitat. If a graduation exists I will then go on and try to explain the observation using scientific knowledge.