Predictions
Graph 1 – Has a maximum of 1 by point (0.5π,1) and a minimum of -1 at the points
(-0.5π, -1)
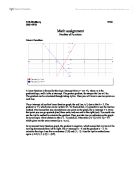
Graph 2 – I expect this graph to have a maximum at (0.25π, 2) and a minimum at
(-0.25π,-2)
Graph 3 – I expect this graph to have a maximum at (-0.25π,2) and a minimum at
(0.25π,-2)
Graph 4 – I expect this graph to have a maximum at (-0.25π,2) and a minimum at
(0.25π,-2)
Graph 5 – I expect this graph to have a maximum at (0.25π, 2) and a minimum at
(-0.25π,-2)
Results
Graph 1
Graph 2 Graph 3
Graph 4 Graph 5
As you can see from all the results my predictions were correct.
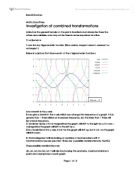
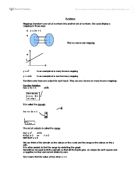
The second transformation combination I will be investigating will be ac the combinations of stretching in the y-direction and translating in the x-direction, this time I’ll be looking at the trigonometric function of cosine indicated in figure 1.0 by a green dotted line.
A cosine graph has no asymptotes but has symmetry in the y-axis, once again I’m going to focus on looking at the maximums and minimums of the graph
y=acos(x+c)
I’ll be using the same values as I did for a, b for a and c.
Predictions
Graph 1 – Will have a maximum at (-π,1), and a minimum at (0π,-1)
Graph 2 – Will have a maximum at (0π,2), and a minimum at (-π,-2)
Graph 3 – Will have a maximum at (0π,2), and a minimum at (-π,-2)
Graph 4 – Will have a maximum at (-π,2), and a minimum at (0π,-2)
Graph 5 – Will have a maximum at (π,2), and a minimum at (0π,-2)
Results
Graph 1 Graph 2
Graph 3 Graph 4
Graph 5
As you can see from all the results my predictions were correct. Graphs 2 and 3 are identical as well are graphs 4 and 5.
The third transformation combination im going to be investigating will be the combination of ad the combination of stretching in the y-direction and translating in the y-axis. This time round I’ll be investigating these changes on the trigonometric function of tangent shown by a red dotted line on figure 1.0
A tan graph has a period of every π, it has 2 vertical asymptotes -∞ at x=− π/2 and ∞ at x= π/2, a tan graph has a rotational symmetry of 180 o about the origin (0,0) I’ll be looking at the graph of
y=atan(x)+d
I’ll be using the following values for a and d.
Predictions
Graph 1 – Will cross the x-axis at (0,1)
Graph 2 – Will cross the x-axis at (0,2)
Graph 3 – Will cross the x-axis at (0,-2)
Graph 4 – Will cross the x-axis at (0,2)
Graph 5 – Will cross the x-axis at (0,-2)
Results
Graph 1 Graph 2 Graph 3
Graph 4 Graph 5
As you can see from all the results my predictions were correct. The d value changes the y value of the co-ordinates; the value seems to rotate the graph around the point where the graph passes through the x-axis. From this I conclude the graph is translated first then is rotated.
The fourth combined transformation I’m going to be looking at will be the combination of b which is stretching in the x-axis and c which is translating in the x-direction. I will be studying this combination with the trigonometric function secant which is 1 over cosine, it is shown by a purple dotted line in figure 1.0
A secant graph has 4 asymptotes at –π/2 and π/2, and has a period every 2π with a range of -∞<y<∞ it also has a rotational symmetry of 180 o about the origin (0,0). I’ll be looking at the graph of
y=sec(bx+c)
I’ll be changing b and c to the following values.
Predictions
Graph 1 –
Graph 2 –
Graph 3 –
Graph 4 –
Graph 5 –
Results
Graph 1 Graph 2
Graph 3 Graph 4
Graph 5
The fifth transformation combination I’m going to be looking at is the combination of b which is stretching in the x-direction and d which is translating in the y-direction. I will be studying this combination with the trigonometric function of cosecant which is 1/sine(x), it is shown by a yellow dotted line on figure 1.0
A cosecant graph has 4 asymptotes at 0π and π, and has a period every 2π with a range of -∞<y<∞ it also has a rotational symmetry of 180 o about the origin (0,0). I’ll be looking at the graph of
y=csc(bx)+d
I’ll be changing b and d to the following values.
Predictions
Graph 1 –
Graph 2 –
Graph 3 –
Graph 4 –
Graph 5 –
Results
Graph 1 Graph 2
Graph 3 Graph 4
Graph 5
The last combined transformation I’m going to be investigating is what happens when you combine c(translating in x-direction) and d(translating in the y-direction). I will be studying this combination with the trigonometric function of cotangent which is 1/tan(x), it is shown by a aqua dotted line on figure 1.0.
A cotangent graph has a period every π and has 2 vertical asymptotes at one at 0 and the other at π. It also has a rotational symmetry of 180 o about the origin (0,0). It has a range of -∞<y<∞ .
). I’ll be looking at the graph of
y=cot (x+c)+d
I’ll be changing b and d to the following values.
Predictions
Graph 1 –
Graph 2 –
Graph 3 –
Graph 4 –
Graph 5 –
Results
Graph 1 Graph 2
Graph 3 Graph 4
Graph 5