Quantitative Prediction:
V = 1/3πr2h
= 1/3π(d/2)2h
= 1/12πd2h {i.e. V ∝ d2h}
h
…but for constant shaped sand piles, we can add more…
h ∝ d
∴ V ∝ d3
So, here is the proof that the volume does vary with diameter, but it does not only vary in general, it effectively varies directly with the cube of the diameter, so that an exponential graph is produced if the graph is plotted (shown →2pages).
METHOD
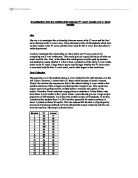
1] Initially, we decided to take 5 diff. volumes to investigate, these were, in cm3, 10, 20, 30, 40, 50; and we chose to take four diameter readings for each volume, to make sure we nullified any incorrect results, in the average. For the four measurements, we took two from each pile, i.e. the ‘x’ value and the ‘y’ value for each, respective pile of the two.
2] The apparatus used were as follows: a small funnel, for steady constant distribution of the sand onto the piles; pieces of graph paper to measure the diameter with; a measuring cylinder for precise measurement of the volume of sand to be distributed.
3] When the volumes were measured out we were careful to look at the graduation of the cylinder from all sides as the sand does not self-level like water.
4] Our method for the equal distribution of the sand was to keep the flow of sand directly over the centre of the paper and consequently directly over the centre of the pile, to make sure that equal amounts of sand fell on each side of the cone. For the same reason we kept the angle of the funnel at a steady 90°. We then also kept the distance between the apex of the pile and the tip of the funnel constant, so that the force of the falling sand on the pile remained uniform, this distance was 5mm.
5] To measure the diameter, we used the graph paper, we had made the sand piles on, and we try to take the best reading as many grains of sand had drifted further than they should have and so we were sensible not to take these into account, when measuring.
The next page shows the pure RESULTS we attained, with all measurements and sub-stages made shown; and the pages after show the graphs plotted.
RESULTS
ANALYSIS
I feel that to a great extent, my results comply with my hypotheses. Clearly, the exponential qualities, of the ‘V vs. d’ graph, can be seen, and in my hypothesis, I said that the volume would be proportional to the diameter cubed. Through inspection, it is clear to see that this hypothesis was correct. For example, if a value for the volume, say 20cm3 is taken, which gives the diameter cubed value of 210.379cm3, and that volume is doubled to get 40cm3, the corresponding d3 value is turned to, 448.136cm3, which is very close to the actual double of 210.379cm3, around 420cm3.
I can now conclude that the volume of a pile of sand does indeed vary directly in relation to its base’s diameter cubed, because all piles of sand follow the same physical rules, and that all the cone-shaped volumes, and subsequently all the triangular profiles, formed by each, are all similar.
EVALUATION
There were some improvements that could have been made: -
[1] The table could have been bumped during the measurement or distribution of the sand and so could have affected the results recorded for the diameter.
[2] The angling of the funnel could have affected the distribution of the sand, and made more fall on one side compared with another, so that the diameters recorded could have been changed. Our method for keeping this variable the same was usually not very effective.
[3] The steadiness of my hand could have also played a key part in the distribution of the sand so, for this reason and the other two, [1] and [2] above, I think that using a clamp would have been a good way eliminate these problems.
[4] We also made a crease in the graph paper for the ease of pouring the sand on the graph paper back into the measuring cylinder. This could have affected the distribution of sand on the paper making more fall on one side than on another, again affecting the diameters.
[5] When we were measuring out the volumes in the measuring cylinder, we found that there were small pockets of air being formed where there was not enough force to collapse them from above. So, these would have significantly affected our results, had they been pockets of air near the centre of the cylinder, which we could not see, and therefore rectify.
[6] Then there was the fact that, however hard you tried, the diameters of no one pile, let alone two, could match up, again due to uneven distribution of sand, and the movement of the graph paper just as the sand piles’ diameters were going to be measured.
[5] Finally, there was the factor of human error and the commonly occurring parallax problem, when using the eye, to measure the volumes and diameters, which would have slightly affected our results, as well.
[6] Of course, if they were available, more accurate material-measurement, ~distribution, and result-measurement equipment would have helped to impede any mistakes occurring due to human error, in measuring and distributing the sand, like, for example, the case of the funnel’s angle relative to the paper, and the case of the hand’s steadiness.