Then after we had taken about thirty results we re-tested them again to insure that the results were totally accurate and no error had occurred.
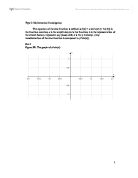
From our results we had taken we plotted a graph with pressure (lb/in2) on the vertical axis and volume (cm3) on the horizontal axis. From all these points we drew a line of best fit.
Analysis
There are a few strange points, which may have been from human error of reading. From the graph we can clearly see that there is a relationship between volume and pressure. The relationship is inversely proportional.
This diagram explains the theory of Boyles law, when you increase pressure by two you half the volume. This is because when you decrease the volume of a substance, all the atoms are in smaller, more compact space so they all hit the sides increasing the pressure. But if you increase the volume then you enlarge the surface area and the atoms have more room to move so less hit the sides and this causes an increase in pressure. Therefore this proves Boyles law, which is that when you half the volume the pressure doubles.
My results do agree with my hypothesis as I stated that my graph would produce a nice curve, which is clearly shown on my graph I have produced. I stated that the results would be inversely proportional and from the equation V α 1/P we can see the results match. If we take an example: 7 α K x 1/70, if we work out K we get it as 490. So now if we do the sum 1/70 times 490 we get the answer 7. This proves that the equation V α 1/P is correct which means the results are inversely proportional. However to plot the graph correctly you need to change you results slightly. If you just plot Pressure over Volume then you will get a curve but to plot the inversely proportional points we have to make all of our pressure points a fraction so we would plot volume over 1/pressure. This gives us a straight-line graph, which is correct for inverse proportion. If you work out the equation then you can see that the results are not precise which is to do with the gas we used. For us to get all the results precise we would have had to use something called “the perfect” gas which is a prime example of a gas to use. This gas will half in volume exactly when the pressure is doubled. Unfortunately there isn’t a gas known to man that does this and air is the closest example, if there is a gas which is perfect and we discover it remains a mystery.
Evaluation
There were a few things, which could have made the experiment better and more efficient.
Firstly the marks on the pressure gauge could have been more precise for accurate readings, as its marks were quite vague therefore we had to estimate whether it was 0.5 or 0.75 etc. This meant there was a lot of room for error.
Another way of boosting the efficiency is to take the readings more than once, the more times the better.
Even with two readings there is still error so more tests eliminates stray readings. The readings that are stray do not really match the equation earlier then we can only deduct that they are results of human error and therefore are needed to be left out and ignored.
To make this experiment even more reliable we could see if Boyles Law still remains or becomes less precise under very high pressure. We could see if the results remain inversely proportional but to get them inversely proportional for any pressure we would have to use “the perfect gas”.
Results