I then used a Casio calculator to generate a random number between 1 and 162, for example I typed (162)Ran# = and obtained a number of 104.7, I then rounded this number to the nearest integer, so the number pupil I would select would be 105. I chose to take a sample of 50 individuals from the population of 162 as this will help to ensure the data is representative as it is about 30% of the population. I then selected these 50 pupils using these random numbers which corresponded with the pupil numbers I had already issued.
If any there were any repetitions of any random number, I simply rejected it on the second time it was produced and generated a new number. I also rejected the number if it corresponded with a pupil that had not sat the examinations or had dropped out of high school and so had no score for either/or Mathematics and English Literature. I would reject these because I could not plot this data on a graph or they would not be part of my statistical analysis.
My Sample of 50 individual's GCSE scores
I am now going to plot these results on a Scatter graph so I can easily see whether the data has a Correlation.
Figure 1- Scatter Graph “A Graph to show the Correlation between Mathematics and English Literature GCSE Scores.”
Both of my variables are random and have a normal distribution. They are also independent of each other.
Analysis
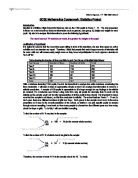
From my Graph I can see that there is a positive Correlation. I will now work out the Product Moment Correlation Coefficient as this is a numerical value which will describe how correlated my set of values are. To do this I will use the following formula:
X = English Literature Score
Y= Mathematic score
Calculating Pearson’s product moment correlation coefficient (PMCC) –
r = 155.92
198.48 × 171.68
r = 155.92
34075.0464
r = 155.92
184.5942751
r = 0.844663248
r = + 0.845 (3.s.f)
A perfect strong positive correlation gives for the PMCC a value of +1, as my results give me a value of +0.84 I can conclude that there is a relatively strong positive correlation between the GCSE scores obtained in English Literature and Mathematics for my sample of 50 individuals.
As my calculation for r = +0.84 and the data I used when calculating r is actually a sample of a parent bivariate distribution, this suggests that there will be a level of correlation within the population, which in my case is the year 11 class of 1998 at Thistley Hough high school. This means my calculated value for r can be used to test whether there is a correlation in my population. I can do this by carrying out a hypothesis test.
The test is carried out by comparing my value of r with the appropriate entry in a table of critical values. This will depend on the size of my sample, the significance level and whether the test is two-tailed or one-tailed. I will carry out 2 hypothesis tests at the 5% significance level (0.05). My first test will be one-tailed and will investigate whether there is any correlation. My second test will be two-tailed and will investigate whether there is a positive correlation in my population using the data from my sample.
Hypothesis test -1
H0: p = 0
H1: p ≠ 0
0.05 Significance level (5%) 2-tailed test
n = 50
Critical value = 0.279 r = +0.845 (3.s.f)
As 0.845 > 0.279, there is sufficient evidence from my sample to suggest that there is a correlation in my population between GCSE scores in English Literature and Mathematics.
Hypothesis test-2
H0: p = 0
H1: p > 0
0.05 Significance level (5%) 1-tailed test
n =50
Critical value = 0.235 r = +0.845 (3.s.f)
As 0.845 > 0.235, there is sufficient evidence from my sample to suggest that there is a positive correlation in my population between GCSE scores in English Literature and Mathematics.
From my Hypothesis tests I have found that there is sufficient evidence from my sample to suggest that there is a positive correlation in my population.
Interpretation
From my investigation I have discovered that in my population, which is the year 11 class of 1998 at Thistley Hough high school, there is a positive correlation between the GCSE scores obtained in English Literature and Mathematics. I know this because I have calculated the PMCC for the sample, and then carried out a hypothesis test so that I could relate my findings to the population.
In relation to my aim, I have completed what I had aimed to do, and I have found a positive correlation within my data which I can also relate to the population. In conclusion to this I have also found that my original conclusion is correct in that there is a positive correlation. I have proved that the conclusion which my English Literature teacher had previously made was wrong for my population. This means that it is most likely that if you are a high achiever in English Literature that you will also be a high achiever in Mathematics.
This data was worth collecting because I have proved that for my population the attitudes of many of the teachers at Thistley Hough high school, but in particular the English Literature teacher, were that English Literature and Mathematics were almost opposites. Although my data does not prove that these subjects and their contents are similar, it can at least have the implication that for my population the pupils found them similar in requirements in that they achieved similar results in both. I know this because I found a strong positive correlation within my sample.
Although there is a high level of correlation between my two variables, I do not believe that this implies causation, for I do not believe that being able to do Mathematics causes you to be able to do English Literature or vice versa. I think that there are other variables, such as intelligence/mental ability, which causes the relationship between my two variables.
Accuracy and Refinements
As my data was obtained as secondary data I am relying on someone else’s data. I obtained my data from Thistley Hough High school. As I did not collect the data myself, I do not know how accurate the data is. There may have been an element of human error, in that the raw data entered into the tables by a teacher/member of staff at Thistley Hough high school may have been entered or copied incorrectly from their records.
The restrictions that I found from using Thistley Hough High school as a source for my data, is that they did not give me all the data which I required to ensure my sample would be representative. I had originally asked for the sex of the pupil so that I could of worked out the percentages of each sex present in they year 11 class and then I could have taken a stratified sample which would improve the quality of my work. If I were to repeat this investigation I would do this.
The restrictions of my sample method were that although it was quite representative due to just over 30% of the population being selected as my sample, it may or may have not been representative of the true amount of males and females present in the class. As I have already concluded I would refine my sample method as I would make it stratified.