The table below was calculated in Autograph.
Overflow – it reached overflow because there are certain x values where there is no point of the graph present.
From the above table that I made in Microsoft Excel, it is evident that the rearrangement method does not work for this rearrangement of the equation as it cannot calculate the y-value for x=0.332207 and beyond.
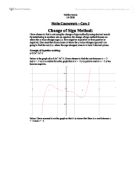
The above is the graph of y=(3x5-x+0.31)1/2 (blue line) and y=x (red line). The purple line shows the method diverging and then it stops when it cannot work out the answer when there is no x or y value.
This graph is an example of one which is diverging – i.e. it is moving further and further away from the point. The point of the rearrangement method is that we get closer and closer to the point that is the solution and therefore this rearrangement is doing the opposite and therefore cannot work.
y=(3x5-x+0.31)1/2
Rearrangement that does work
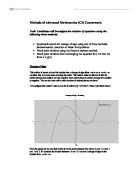
I then rearranged the formula again to find the rearrangement x=3x5-x2+0.31. I then graphically represented this equation by drawing the graph of y=3x5-x2+0.31. This rearrangement clearly worked as the graph is converging – i.e. it is getting closer and closer to the point where the solution is present. Therefore this rearrangement works
The above is the graph of y=3x5-x2+0.31 (blue line), y=x (red line). The black line shows the method converging and coming closer and close to the solution.
Above it is clear that the solution is 0.2503 (to 4 significant figures) as the difference between x and y at this point is 0. Using Autograph does not give us more 4 significant figures though which is insufficient.
The last two values for x and y are the same therefore this is the solution to the equation for the root that I was looking for. The solution to 5 significant figures is x=0.25030.
Gradient:
y = 3x5-x2+0.31
dy/dx = 15x4-2x
= 15 x 0.2502984 – 2 x 0.250298
=0.500596 <1
I have shown that out of two different rearrangements of the same formula, one fails to find the solution at one point whereas the other finds that solution. This shows both success and failure using the rearrangement method whilst using the same formula. The one that fails has a gradient of outside the range -1<0<1 whereas the rearrangement that succeeds has a gradient at the solution which is within this range.
Newton-Raphson Method
The Newton-Raphson is another fixed-point interation. I will use the formula:
xr+1=xr –f(xr)
f ’(xr)
Equation that works
I have used the equation y=x4-0.5x-0.24. To use the Newton-Raphson method, I need to differentiate this equation to find f ’(x) therefore I differentiated my equation to get y=4x3-0.5.
f(x)= x4-0.5x-0.24
f ’ (x) = 4x3-0.5
Therefore the iterative formula for my equation therefore is:
xr+1=xr – x4-0.5x-0.24
4x3-0.5
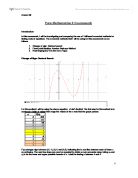
Above is the graph of the equation, showing the tangents to the graph and the roots of this equation.
Above is a zoom in of the equation to show the tangents and roots getting closer and closer to where the curve crosses the x-axis.
I started with the estimated x-value of x=-1 as I can see that the curve crosses the x-axis between x= -1 and x= 0. The below is worked out in Autograph.
xr+1=xr – x4-0.5x-0.24
4x3-0.5
Below I substituted the value of x=-1 into the equation on Excel. I then worked out what the answer was which was -0.72.
X2= – 1 – (-1)4 - 0.5 x -1 -0.24
4 x (-1)3 – 0.5
The table below shows the x-value, y-value and the difference between the two up until the point the x value repeats.
If I substitute x values into the original formula which are either side of where the x-value repeats in the table (x= -0.41859) then we can see that the y value sign does change here. This shows that my root is between these two values
x value y value
Therefore I am taking my first root as x=-0.41859
Finding the other root:
I will again use the following iterative formula:
xr+1=xr – x4-0.5x-0.24
4x3-0.5
I started with the estimated x-value of x=1 as I can see that the curve crosses the x-axis between x= 1 and x= 0. The below is worked out in Autograph.
To establish error bounds, if I substitute in x-values into the original formula which is just above and below x = 0.91365 (which is the number that repeats in the table above) then it is clear that the sign of the y values change here, hence the curve must cross the x axis.
Therefore I am taking my second root as x=0.91365
Equation that does not work
Sometimes this method does not work. This would happen if the tangent to the curve crosses the x axis at coordinates where the graph itself does not have any coordinates (i.e. where the graph does not exist)
Above the red line is the graph of the equation I am going to use and the green line is the tangent to the curve – it is clear that where it crosses the x axis there is no value for the equation.
To show this failure I am going to use the equation y=ln(2x3-2x2+7x-2.3)
Above is the graph of y= ln(2x3-2x2+7x-2.3)
The iterative formula for this equation will therefore be:
xr+1=xr – ln(2x3-2x2+7x-2.3) (2x3-2x2+7x-2.3)
(6x2-4x+7)
I am going to start at the point x=1
At #NUM! the computer cannot calculate the value.
Comparing the Methods
I am now going to compare the methods. To do this, I am going to use the same equation that I used to do the Change of Sign Method. I am then going to use that equation with the other two methods to calculate the same one root found by the Change of Sign Method. I had considered using the Rearrangement method when I discovered that it crosses the x-axis twice between two integer values and therefore would not work for the Change of Sign Method.
Change of Sign Method
Below is the graph of y=0.5x5-3x3-3. I have chosen to find the root between x = -2 and x = -1 as it is evident from the graph that at x = -2 y is positive and at x = -1 y has become negative.
Below I have zoomed in on the graph so that it is clearer that there is a root between x = -2 and x = -1.
Below I have substituted x values between x = -2 and x = -1, starting by decreasing the x value by 0.1. The highlighted values are the values where the y values change signs. I then searched the values between x = -1 and x = -1.1, decreasing the x value by 0.01 at a time. The change of sign here occurred between x = -1.07 and x = -1.08. I then chose to look at the x values between these two values. I decreased the x value by 0.001 between x = -1.07 and -1.08. The change of sign between these two values occurred between x = -1.073 and x = -1.074. The root needs to be given to 3 decimal places and therefore I need to check the values between these two values to see whether the root is closer to the lower or higher value of x.
To 3 decimal places, one root of the equation y=0.5x5-3x3-3 is x = -1.074 as the change of sign occurs between the interval x= -1.0737 and x = -1.0738 therefore I have taken the root as -1.07375 with an error bound of + or – 0.00005
Rearranging Method
Above the blue line is the line y=x, the red line is the rearrangement equation and the black line is showing the method get closer and closer to the solution.
The below was worked out in Autograph.
The below I worked out in Excel. The x-values repeat at the bottom of the table at the value x=-1.07371399 therefore this is the solution for this method
Newton-Raphson Method
The above shows the method getting closer and closer to the solution.
The below was worked out in Autograph.
The below is the iterative formula I need to use:
xr+1=xr – 0.5x5-3x3-3
2.5x4-9x2
I worked out the above using Excel. The x-value repeats at -1.073714 therefore this is the solution.
I substituted in values above and below this and the sign of the y-value did change showing that it crossed the x-axis at this point.
The change of sign method is the easiest for less-experience mathematicians as it does not require previous knowledge of how to differentiate whereas the other two methods do. However, the change of sign method also takes a lot of attempts to arrive to the answer and it is harder to get a high degree of accuracy.
The rearrangement method is quite a difficult method to use as it requires you to rearrange the formula in such a way that the gradient where it crosses the y=x line is between -1 and 1. Quite often this does not happen and so it only works when you find the right rearrangement. This can therefore be quite time consuming. However, once the rearrangement is found the formula can be entered on Excel and all the calculations are done with only a few clicks. This is not so simply done with the Change of Sign Method. It is not, however, as time consuming as the change of sign method is.
The Newton-Raphson is easily the most efficient as it takes many fewer steps than the Change of Sign Method and many fewer iterative steps than the Rearrangement Method. It is much less time consuming and the calculations can be easily done in Microsoft Excel.
The Change of Sign method is the most difficult method to use if you want a high degree of accuracy. It is the best one to use if you only want two or three decimal places of accuracy as it is simple and does not require complicated maths. The Rearrangement and Newton-Raphson Method are the better methods for high degrees of accuracy. Out of these the Newton-Raphson Method tends to reach the answer in the quickest way and involves no difficult rearranging.