My hypotheses for this investigation are:
- There is a negative correlation between age and price.
- There is a negative correlation between mileage and price.
- Executive cars are in general more expensive then sports cars.
- Sports cars tend to be more expensive then small cars.
- The correlation between age and price will be stronger for small cars.
- The influence of price on age will be stronger then influence of mileage on age.
I will need to select samples from all the cars and from the types of cars I have chosen to investigate further. I will select stratified samples from all the cars and random from the types of cars I have chosen. I will use random samples for part C, D, E, F, G and from each group I have chosen to investigate and stratified samples for parts A and B. to do this I will use the computer to randomise the data to get random samples, however the samples may produce some outliers (very old cars with very high prices, Rolls Royce or Jaguar etc.) such data I will ignore but I will make a note of the numbers of outliers.
I will plot each sample on scatter graphs (one factor against price)
8 scatter graphs will be produced:
- stratified sample: age, price
- small cars: age, price
- executive cars: age, price
- sports cars: age, price
- stratified sample: mileage, price
- small cars: mileage, price
- executive cars: mileage, price
- sports cars: mileage, price
I will draw lines of best fit on each scatter graph, working out mean first. I will work out spearman’s coefficient of rank correlation for each scatter graph. I will use y = mx + c to work out equations of line of best fit. I will use the lines of best fit to predict prices given age or mileage for each type of car that I have chosen. I will intercept the meaning of gradient and use it to compare depreciations. I will work out mean price and range for each type of car and set out in a table together for easy comparison. Nxst I will use cumulative frequency graphs to compare prices of small, executive and sports cars.
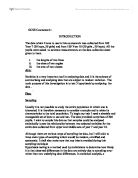
My recorded prices in grouped frequency table to compare prices of my chosen cars will be set out in this table:
And cumulative frequency table:
Next I will plot cumulative frequency graphs on one graph paper (using different colours) and find quartiles Q1, Q2, Q3 for each type of car. I will then draw box and whisker diagrams using different colours against one scale. Then I will make comparisons of prices using medians and by using interquartile ranges. Then finally I will compare the distribution of prices of small, executive and sports cars using histograms with unequal intervals.