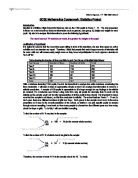
The correlation coefficient is how strong a certain correlation is. Certain calculations have to be done to obtain this one significant number.
Example:
For example of use see appendix 2.
What does r actually tell you?
•The nearer the value of r is to 1 the stronger the positive linier correlation between the independent and dependent variables.
•For values between -1 and 0 the closer the value of r gets to –1 the stronger the negative linier correlation between the independent and dependant variables.
The example above has a correlation coefficient of; r = 0.906 and this shows that it has a fairly strong positive linier correlation but if it had a correlation coefficient of r = 0.5648 you would say that it has a weaker positive linier correlation. Basically a correlation coefficient tells how good a correlation you have in your graph.
Although the correlation coefficient can be found without plotting a scatter graph it is always more useful to, as it gives you a picture of the correlation and also helps distinguish any outliners.
I have done a correlation coefficient for my data. (See appendix 3)
As can be seen the correlation coefficient is r = 0.911465 which means that there is a very strong positive correlation between I.Q and Sats Results, telling me that
I.Q does affect Sats Results because of this strong correlation.
Regression Line?
To obtain the regression line there are steps that have to be followed:
-
Gradient meaning that the straight-line law y=a+bx has to be used. Since the line is a straight line, we use y=a+bx.
b = gradient found using:
In this case the gradient is how much the sat total increases for every 1 I.Q point increase.
-
The experimental results are used to find the regression line. This regression line is known as the regression line of y on x. The distance from the line y=a+bx to a plotted point is called a residual.
If the distance from the line to the plotted point is very small the line may be drawn through the points by eye but it is much better to find the line of best fit using the method of least squares.
■ The equation of the regression line of y on x is:
where
Example:
The equation of the regression line can now be used to make estimates the response variable for any given value of explanatory variable within the rage of the data. This is called interpolation.
Test for someone with I.Q of 100.
y= 0.155551 x= -3.68957
x= 80
y= 0.155551 80-3.68957
y= 8.77123
Therefore a student that has an I.Q of 100 should get a sat result of 8.77123.
To draw the line of best fit I needed to do five calculations like the ones above and plot the predicted sat result against the given I.Q and join up points with a line. The calculations used to draw the line of best fit are attached to appendix 1, the graph.
From my investigation I have:
-Proved my hypothesis; that your I.Q does effect how well you do in you Sats.
-Explored new techniques to develop my mathematical skills using A level maths; correlation coefficients and regression.
The one way in which I could extend my investigation is by plotting the average number of hours TV watched per week against the I.Q and Sats Results to see weather the amount of TV watched affects I.Q and Sats Results.
In order to do this I would have to consolidate I.Q and Sats results in to one value.
The way in which this is done is by using this formula:
= 1 average score
> 1 means better than expected results
< 1 means poorer than expected results
To see how the above equation was obtained see appendix 4.
E.g.
This number would be plotted against the average number of hours TV watched per week.
This I would have done but did not for 2 reasons:
- All the values are only 20% apart
- From looking at the raw data I saw no correlation as was very random (see appendix 3)
A further extension I could do is plot the consolidated values against other factors that could effect the I.Q and Sats Results such as; How much homework they do? Do they have brothers or sisters? What kind of foods they eat?