Method
For this investigation, I am finding out whether it possible to gain information about authorship of a text. I will be using and adult text and a child text. The adult text that I will be using is Great Expectations by Charles Dickens. This book consists of 484 pages. The child text I will be using is Charlie and the Great Glass Elevator by Roald Dahl. This book consists of 190 minus eight pages at the beginning of the text. I will select 50 random pages from each book. I will then select a random line and word on each of these pages.
Assumptions
The distribution of the parent population is normal. We have to assume that the distribution of the sample is also normal to have accurate results. I have assumed that a sample size of 50 would give me a normal distribution.
Statistical Theory
After collecting the data, I will set the results out in a tally chart because it is easier to understand and analyse.
I will use the central limit theorem because it will make it easier to make predictions about the distribution of the sample mean even if the distribution of the parent population is not known.
I will draw a frequency distribution graph to show the distribution of the data for both books. I will also work out the mean to work out the average. The variance and standard deviation would help me measure the spread of the data. If I work out the standard error then it will help me to be confident in my estimate of the population mean.
In addition, I am going to use unbiased estimation because this will help me to find the variance of the parent population.
Data Collection & Statistical Analysis
Raw Data
Raw data for Great Expectations by Charles Dickens.
Raw data for Charlie and the Great Glass Elevator by Roald Dahl.
Frequency distribution
I will now arrange the data in a frequency distribution table to make the data easier to understand and analyse.
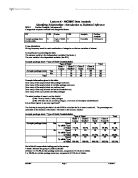
Frequency distribution table for Great Expectations by Charles Dickens.
Frequency distribution graph for Great Expectations by Charles Dickens.
Frequency distribution table for Charlie and the Great Glass Elevator by Roald Dahl.
Frequency distribution graph for Charlie and the Great Glass Elevator by Roald Dahl.
Mean
x = Σfx
Σf
x = mean
Σfx = the total of frequency times the interval
Σf = the total of frequencies
Great Expectations
Σfx = (1×2) + (2×13) + (3×8) + (4×5) + (5×3) + (6×4) + (7×4) + (8×6) + (9×0) + (10×0) + (11×3) + (12×2)
= 244
Σf = 2 + 13 + 8 + 5 + 3 + 4 + 4 + 6 + 0 + 0 + 3 + 2
= 50
244 = 4.88
50
Charlie and the Great Glass Elevator
Σfx = (1×3) + (2×6) + (3×12) + (4×9) + (5×9) + (6×4) + (7×2) + (8×4) + (9×0) + (10×1)
= 212
Σf = 2 + 13 + 8 + 5 + 3 + 4 + 4 + 6 + 0 + 0 + 3 + 2
= 50
212 = 4.24
50
Variance
σ² = Σfx² - x²
Σf
Great Expectations
Σfx² = (1²×2) + (2²×13) + (3²×8) + (4²×5) + (5²×3) + (6²×4) + (7²×4) + (8²×6) + (9²×0) + (10²×0) + (11²×3) + (12²×2)
= 1656
Σf = 2 + 13 + 8 + 5 + 3 + 4 + 4 + 6 + 0 + 0 + 3 + 2
= 50
x² = 4.88²
= 23.8144
Σfx² - x² = 9.3056
Σf
Charlie and the Great Glass Elevator
Σfx² = (1²×3) + (2²×6) + (3²×12) + (4²×5) + (5²×9) + (6²×4) + (7²×2) + (8²×4) + (9²×0) + (10²×1)
= 1102
Σf = 2 + 13 + 8 + 5 + 3 + 4 + 4 + 6 + 0 + 0 + 3 + 2
= 50
x² = 4.24²
= 17.9776
Σfx² - x² = 4.0624
Σf
Standard Deviation
σ = Σfx² - x²
Σf
σ = √ (variance)
Great Expectations
√9.3056 = 3.050508154
Charlie and the Great Glass Elevator
√4.0624= 2.01553963
Unbiased Estimation
A sample statistic is called an unbiased estimator if its expected value is equal to the population it is estimating. Otherwise, the statistic is known as biased.
The Mean
The sample mean, x, is an unbiased estimator of the population mean. The mean of all possible sample means, with the sample size n, is equal to the population mean.
The Variance
The sample variance is a biased estimator of the population variance. S² is an unbiased estimator of the population variance.
S² = n × Σfx² - x²
n-1 Σf
Great Expectations
S² = 9.3056 × 50 = 9.495510204
49
Charlie and the Great Glass Elevator
S² = 4.0624× 50 = 4.145306122
49
From this I can work out the unbiased standard deviation.
Great Expectations
√9.495510204 = 3.081478574
Charlie and the Great Glass Elevator
√4.145306122 = 2.036002486
Standard Error
s.e. = σ
√n
Where σ = standard deviation.
√n = Square root of the number of samples.
Great Expectations
s.e = 3.050508154 = 0.431407
√50
Charlie and the Great Glass Elevator
s.e = 2.01553963 = 0.28504
√50
Confidence Intervals
95% confidence interval for the population mean
P (X – 1.96 s.e. < μ < X + 1.96 s.e.) = 0.95
Great Expectations
P (4.88 – 1.96 × 0.431407 < μ < 4.88 + 1.96 × 0.431407)
= 4.88 – 0.845558 < μ < 4.88 + 0.845558
= 4.034442 < μ < 5.725558
Charlie and the Great Glass Elevator
P (4.24 – 1.96 × 0.28504 < μ < 4.24 + 1.96 × 0.28504)
= 4.24 – 0.558679 < μ < 4.24 + 0.558679
= 3.681321 < μ < 4.798679
90% confidence interval for the population mean
P (X – 1.645 s.e < μ < X + 1.645 s.e) = 0.90
Great Expectations
P (4.88 – 1.645 × 0.431407 < μ < 4.88 + 1.645 × 0.431407)
= 4.88 – 0.709665 < μ < 4.88 + 0.709665
= 4.170335 < μ < 5.589665
Charlie and the Great Glass Elevator
P (4.24 – 1.645 × 0.28504 < μ < 4.24 + 1.645 × 0.28504)
= 4.24 – 0.468891 < μ < 4.24 + 0.468891
= 3.771109 < μ < 4.708891
Central Limit Theorem
If the sample size is large enough than the sample means is approximately normal, irrespective of the distribution of the parent population. The mean of the distribution of the sample means is approximately equal to the mean of the parent population. The variance of the distribution of the sample means is approximately the variance of the parent population divided by the sample size. These approximations get closer as the sample size gets bigger. These important results are known as the Central Limit Theorem.
If X ~ (unknown)(,2) then Xn ~ N (,2/n)
Provided that n is large enough. n30 is a good rule to follow.
Great Expectations
X50 ~ N (4.88,0.186112)
Charlie and the Great Glass Elevator
X50 ~ N (4.24,0.081248)
Conclusion
After completing all of my calculations for my data, some of the results do not look sensible. The frequency distribution for Great Expectations did not look realistic because there was an increase at 8 letters per word and 11 letters per word. The frequency distribution for Charlie and the Great Glass Elevator looked a little more realistic but there was still a slight increase at 8 letters per word.
When I worked out the mean for the 50 sets of data I collected, I noticed that Great Expectations had a greater mean than Charlie and the Great Glass Elevator. So therefore my predictions for this was correct.
I also noticed that the variance and the standard deviation of Great Expectations were higher than that of Charlie and the Great Glass Elevator. This was also true of my predictions.
The standard error for Charlie and the Great Glass Elevator was lower than the standard error for Great Expectations. This showed that Great Expectations had more variation in the sample means values than Charlie and the Great Glass Elevator.
Using the unbiased estimator I worked out the variance and the standard deviation of the parent population by just using the sample data. When I worked them out I found that the variance of the sample and the parent population were very alike. The standard deviations of the sample data and the parent population followed a similar pattern.
The central limit theorem made it possible to declare that the sample size that I used was large enough to be normally distributed. This is not supported by the fact that my frequency distribution graphs did not produce bell shaped curves. An improvement could have been to collect more data.
Interpretation and Validation
Mean
The mean is the average of the sample of data collected. The mean of the sample of data collected for Great Expectations is 4.88. The mean of the sample of data collected for Charlie and the Great Glass Elevator is 4.24. This shows that Great Expectations uses larger words according to my sample.
Variance and Standard Deviation
The variance is a measure of spread. The variance for Great Expectations is 9.3056. The standard deviation for the novel is 3.050508154. The variance for Charlie and the Great Glass Elevator is 4.0624. The standard deviation is 2.01553963. This shows that Great Expectations had a wider spread of words used.
Standard Error
The standard deviation of the distribution of the sample mean is called the standard error of the mean. The larger the sample size is the smaller the standard error. The standard error of the mean for Great Expectations is 0.431407 and the standard error of the mean for Charlie and the Great Glass Elevator is 0.28504.
Confidence Intervals
For Great Expectations, I am 95% confident that the parent population mean is between 4.034442 and 5.725558. I am 90% confident that the parent population mean is between 4.170335 and 5.589665.
For Charlie and the Great Glass Elevator I am 95% confident that the parent population mean is between 3.681321 and 4.798679. I am 90% confident that the parent population mean is between 3.771109 and 4.708891.
The width of the confidence interval increases as the confidence percentage increases. This can be clearly seen from the calculations that were done with the 95% and 90% confidence intervals.
Unbiased Estimator
An unbiased estimator is one for which the mean of the distribution is equal to the mean of the population value it is estimating. The mean of the random sample is an unbiased estimator of the population mean. The unbiased variance of the parent population for Great Expectations is 9.495510204 and for Charlie and the Great Glass Elevator is 4.145306122.
Communication
Limitations
One major limitation was the amount of samples that I collected. If I had collected more samples my data would have increased in accuracy. Because of the time allowed to complete the investigation collecting 50 samples from both the books seemed sensible. If I were to repeat the investigation I would increase the number of samples that I collected because this would increase the accuracy of my experiment.
Extensions
To extend the investigation I could have looked at the number of words per line. I could have looked at the number of words per page. I could have also looked at the number of paragraphs per page.
Improvements
To improve the investigation, I could have collected more results. This would lead to the sample mean being more similar to the population mean.
I could have also collected different types of results. I could have looked at the number of words per page.
Conclusion
In conclusion, my results show that it is possible to gain information about authorship of a text using statistical measures. My results show this because the adult text has a higher average of letters per word and also has more variation of word length. More information could be gained by collecting a larger sample size.