Then I will do the same for year 11 and see what I find out using a mixture of histograms, box plots and scatter diagrams.
Initially I shall start off with the year 7’s.
This table shows that there are 131 girls and 151 boys within the total of 282 of year 7 pupils. This means that I will have to use these percentages within my rather reduced sample of 50 children. That means that within my sample there must be 23 girls, and 27 boys. I will sort data within excel, for each gender, and choose the top 23 random girls, and top 27 random boys. Then I will create a total for each student selected within the sample for a total Ks2 mark for the student. Then put each student into different groups according to their total mark.
This data set will then be used to create a histogram.
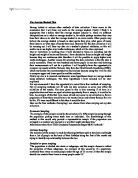
I have chosen to use such small class widths in the centre of the data, is because it was clear to see that there was going to be a large amount of the marks in the middle range somewhere, therefore I decided to split it up so that I could discover more precisely exactly where the main amount of the marks lay.
It’s clear to see from the histogram, I have drawn that the majority of pupils from year 7 have achieved between 13 and 15 total, so an average key stage 2 mark of about 4.7. There are very few students who obtained less than a total of 10 for their key stage 2 results. The general shape of the histogram is to be expected, with a few people who achieve the high scores, and who score the low ones, whereas the majority lay somewhere in the middle.
I could also show the results in a cumulative frequency graph, by calculating the highest and lowest cumulative frequencies myself to give me a pair of boundaries, and then letting excel calculate the 3 quartiles to be able to draw the graph. In order to do this, you must type in “=quartile(range),(1,2, or 3, depending on which quartile you want measuring)”.
In the cumulative frequency graph, you can see that the key stage two results of the students has a symmetrical distribution, as the median is exactly in the middle, of the lower and upper quartiles. This means that the majority of students lay somewhere in the middle of the class. A box plot can further prove this.
Finally, I could display my sample in a box plot form, as follows:
Minimum: - 8
Lower Quartile: - 12
Median: - 13
Upper Quartile: - 14
Maximum: - 16
Inter quartile range (IQR): - 2
I will remark on the distributions from the box plots, after I have devised one for the year 11 group. (See page 6)
Now I am going to investigate the equivalent, but for the year 11’s.
This table shows that there are 86 girls and 84 boys within the total of 170 of year 11 pupils. This means that I will have to use these percentages within my rather reduced sample of 50 children. That means that within my sample there must be 25 girls, and 25 boys. I will sort data within excel, for each gender, and choose the top 25 random girls, and top 25 random boys.
Then I will create a total for each student selected within the sample for a total Ks2 mark for the student. Then put each student into different groups according to their total mark.
This data set will then be used to create a histogram.
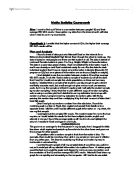
Yet again, comparing it with the year 7’s distributions, the majority of the students lay somewhere in the middle with an average mark of around 4.6 and the general shape is virtually identical, with few people gaining the highest and lowest marks, therefore they are both relatively symmetrical.
I could also show the results in a cumulative frequency graph, by calculating the highest and lowest cumulative frequencies myself to give me a pair of boundaries, and then letting excel calculate the 3 quartiles to be able to draw the graph. In order to do this, you must type in “=quartile(range),(1,2, or 3, depending on which quartile you want measuring)”.
In the cumulative frequency graph, you can see that the key stage two results of the students has a symmetrical distribution, as the median is exactly in the middle, of the lower and upper quartiles. This means that the majority of students lay somewhere in the middle of the class. A box plot can further prove this.
Finally, I could display my sample in a box plot form again, but I will pitch it onto the same axes as the box plot displaying the year 7’s distributions, so that I can compare them both much better.
Minimum: - 9
Lower Quartile: - 12
Median: - 13
Upper Quartile: - 14
Maximum: - 18
Inter quartile range (IQR): - 2
The box plot has an outcome exactly the same to the one I had previously predicted. The middle half of the class, are exactly the same for both years. There are just one or two pupils that are dragging the minimum mark down for the year 7’s, and a few high achievers pushing the side up for the year 11’s. Looking at the general range, the marks are lower for year 7’s, than year 11’s.
Summary
Before I summarise this section, I must first recap the hypothesis:
How the education system has changed in its efficiency, over four years.
Using the above data and my graphs that I have created on other sheets, I can conclude that the education system has changed over four years. It would appear that the education system has declined in its efficiency over the four years. I have come to this decision using all my graphs and data boxes.
This may not be true for the entirety of the two year groups, as a sample of 50 people, only gives us a slight insight into the actual size of the year groups. The education system may have infact improved over the four years; however, my investigation has proved that it did not.
If I had to do this hypothesis again, then I would require the whole year group, and perhaps even from a different school(s) as the year 11 from Jordan Hill may have been a relatively unproductive year group, then perhaps I would be able to get a true idea of how the education system changed over the time span.
Random sampling:
From this point forward I will be using a random sample. I have acquired this random sample through excel, and here is a list of all the names of the students, I used accompanied by the relevant information I need.
Hypothesis 2: The weight of a pupil will increase with the amount of television watched per week.
This hypothesis uses two sets of data (weight and amount of television watched per week) that can be grouped. This will allow me to accurately compare the two sets of data, and I should therefore be without any problems. After I have compared the sets of data I have ascertained, I should be able to accurately find out whether, or not there is any correlation between the two sets of data.
I will start by comparing histograms for both sets of data;
Initially, the table for weight
As you can see from the graph I have drawn, there is a large amount of pupils weighing 30kg, or less. However, there is a large increase in the amount of pupils weighing more than this as I move up the graph. If my hypothesis is correct then this will be the group of pupils who watch the most television per week.
Now I will draw the frequency density table for the number of hours of television watched per week.
The graph is quite disappointing because, of the last figure it has, misshapen the scale somewhat, and produced, an almost useless graph, however I still realised that the histogram appears to have a large number of pupils who watch less than 30 hours of television per week. This graph has no correlation with the graph for weight and is therefore quite worrying, as there seems to be no connection between the amount of television watched by the students and their weight. Before I come to a conclusion however, I must study my results in more detail. Next, I will be using a cumulative frequency graph to look at my results in a different light, and be able to draw a box plot (without using excel).
Here is a table I have produced in order to be allowing me to create a cumulative frequency graph for the weight of the students.
If you look at the graph, it clearly shows a steady rise in the weight of the pupils. This tells me that this graph is symmetrical, however this can only be determined with the use of a box plot. Here is the data required in order to draw a box plot.
Minimum: - 26
Lower quartile: - 41
Median: - 47.5
Upper quartile: - 55
Maximum: - 68
Interquartile range: - 14
If you then, look at the relevant box plot I have produced, in my graph booklet, it shows that my beliefs were correct, in that the data set is symmetrical when put into graph form. I can determine this through the fact that the median appears to be directly in between the upper, and lower quartiles, therefore showing that this graph is definitely symmetrical. There is however, a small negative lean with the graph with it facing in the direction that there must more pupils in my sample that weigh over 40 kg, than under it.
Now I will do exactly the same, but for TV hours watched.
See graph booklet for the cumulative frequency relating to this table.
The graph has a steep incline at the beginning, which levels out at the end. This shows to me that this graph will definitely have a positive skew when drawn as a box plot, and that my hypothesis is wrong. I will continue to investigate this hypothesis however, as there might be some correlation between the data.
Here is the relevant data needed in order to draw my box plot.
Minimum: - 3
Lower quartile: - 9
Median: - 13
Upper quartile: - 16
Maximum: - 170
Interquartile range: - 7
I have drawn my box plot (refer to graphs booklet) and I have found that the amount of hours of television watched per week by each student definitely has a positive skew. We can tell this as the lower quartile, median and upper quartiles are all ‘bunched’ together on the left-hand side of the box plot. This is a definite sign of a positive skew as they are all at the start of the graph. Using this I can say that a majority of the students in my students in my sample watch less than 20 hours of television per week.
I will now look at the mean average for each of the different sets of data I am analysing, weight and number of hours of television watched per week;
Mean = (frequency x midinterval) / frequency = 1434.5/30 = 47.8
Mean = 18.5
By looking at the results of these two tables I can conclude that there is no correlation between the two sets of data. This is quite disappointing as I was expecting the students weight to increase along with the amount of hours of television watched per week. Looking at the median, mode and standard deviation of the data, as well as studying the scatter graph I have created in my graphs booklet, I can back up the results of my findings.
Distributions are usually compared using measures of spread and central tendency.
Standard deviation is a measure of spread that calculates the average deviation of all values from the mean.
Weight Television hours watched
IQR = 14 IQR = 7
Median = 15.5 = 40<weight<50 Median = 15.5 = 10<TV<20
Mode = 40<weight<50 Mode = 10<TV<20
Standard Deviation = 3.406 Standard deviation 5.745
With the aforementioned results, and the scatter graph in my graphs booklet, I can conclude that there is unfortunately no correlation between the two sets of data I have acquired.
The scatter graph I have drawn from the first 10 pupils from my list (see just before the start of this hypothesis) also shows me that there is no correlation between the data. It would’ve been the easiest way of showing if it did, but it obviously didn’t because if there were then they would appear to be in a straight line or curve, with only a few outliners. In this case there are several outliners, and the line of best fit only serves to show the direction in which the plots should have gone if there was to be any correlation between the two sets of data.
Summary
Before I summarise this hypothesis, I think I should firstly look back and see what I initially predicted:
The weight of a pupil will increase with the amount of television watched per week,
After using all the data I have acquired on the two statistics I have come to the conclusion that there is no correlation between the two sets of data. This means that no matter how many hours of television are watched per week per student it will have no effect on their weight.
This may not be true for the entire population however, as a sample of 30 people only gives me a slight insight into the actual size of the entire population. The amount of hours of television watched per week could indeed have an effect on a students weight in kilograms, however in my sample I have proved that it did not.
If I were to investigate this hypothesis again, then I would require a larger sample size in order for my investigation to be effective. This sample size would have to be in the region of 150 to 300 as I fell that a sample this big would truly reflect the actual size of the entire population
Hypothesis 3: the hair colour of a pupil will affect their I.Q.
T o investigate this I have drawn a series of graphs, in order to compare the hair colour and I.Q. of the students in my sample. However, with the hair colour of the pupils there was very little I could do apart from draw a bar graph for the different hair colours and the mode average. The bar graph can be found in my graphs booklet, and the mode average is shown below.
The graph shows me the number of students with varying types of hair colour. As you can see, more pupils have brown hair rather than black hair whereas only 2 pupils have a hair colour other than brown, black or blonde.
Mode = Brown
A bar chart is the only reasonable way I can display the hair colour of the students. Below is the sampled data, I have analysed and a graph accompanies it (in the graph booklet) for the pupil’s I.Q. I did not have any problems with this data, and it is therefore displayed in the form of a histogram and a cumulative frequency graph, among others.
The histogram itself (which can be found in the graph booklet) shows me that the majority of the students had an I.Q ranging between 100-110. A small minority of the students had an I.Q below 80.
After constructing a histogram for my data, I will then created a cumulative frequency graph in order to examine the trend the I.Q took and find the interquartile range of my data.
Here is the relevant data to the cumulative frequency graph.
You can find the graph, in my graph booklet and if I study it, I can see that the graph shows the I.Q of the pupils has a skewed negative distribution, as the median is closer to the upper quartile then it is the lower quartile. This means that there is a noticeable amount of students with a high I.Q in my sample. A box plot of the graph can further prove that the data has a negative distribution.
Minimum: - 72
Lower quartile: - 94
Median: - 104
Upper quartile: - 109
Maximum: - 120
Interquartile range: - 7
Within the above data, I compiled to be able to draw a box plot; the minimum for my data set for I.Q was actually 11. I regard this particular statistic as an anomaly, as I believe that nobody could achieve 11 as an I.Q, as it is very unrealistic.
Studying the box plot (included in the graphs booklet) in more detail I can quite clearly see that the I.Q of the pupils clearly has a negative skew distribution. We can tell this, as the median is noticeably closer to the upper quartile, than the lower quartile. Using this knowledge I can safely say that the median average I.Q of the students is higher than the mean average I.Q. However, as I can only compare the I.Q with the I.Q with the hair colour through the modal average this makes the median and mean, although interesting, totally and utterly useless, when it comes to coming the hair colour of the students with their I.Q.
Summary
Before I summarise this question, I must first re-cap the hypothesis:
The hair colour of a pupil will affect their I.Q.
Using all of the above data, plus my graphs in the graph booklet, I can conclude that hair colour does have some effect on the I.Q of a student. Comparing the two separate modes can show this:
Hair colour: Brown
I.Q 100 –110
There were 12 people in my sample who had brown hair. There were 14 people in my sample who had an I.Q between 100 and 110. This means that there must be some connection between hair colour and I.Q as both of these numbers are just under 50% of the total data collected in my sample.
Of course, this conclusion may not be true for the entire population of students in the data, as my sample is not big enough to reflect the whole population. However, my sample size is big enough to give a small insight into what could be the case in the entire student population. My conclusion that students with brown hair will have an I.Q between 100 and 110 is justified in my sample as ahs been proven by my use of several different methods in order to analyse the data I have got.
In my sample of the I.Q there was only 28 valid results when I collected a sample of 30 (as can be seen in cumulative frequency chart). One result was an I.Q of 11. This, as I have already stated, I do not believe to be possible as someone with an I.Q score this low would be allowed to attend any sort of school! The other anomaly was that someone didn’t even have an I.Q score. These anomalies in my data can both be 1 of 2 things. Firstly, that they are simple mistakes on the spreadsheet of data, or secondly, that they are mistakes made during the marking of the I.Q test. I believe however, that they are mistakes made during the writing of the spreadsheet and that they have no real reflect on the data at all.
If I were to investigate this hypothesis again, I would take a sample of at least 200 people, and maybe even students from a different school, or area to, 1. Discover whether any environmental aspects may affect their results, 2. See if there were any differences perhaps in teaching technique, and 3. To allow me to get an accurate view of the population as a whole.
This would also allow me to develop an accurate conclusion, and truly find out if a students hair colour affects their I.Q. Another method I would use would be to group the data acquired on hair colour by order of spectrum. This would allow me to make a cumulative frequency graph for the data, and would thereby allow me to find such things as the standard deviation and distribution for the students hair colour, as it would then be classed as continuous data.
Conclusion
Finally, I must look at the original point of this investigation:
Describe an average school pupil
Using the results I have acquired from my hypothesis, I am able to state that the average school pupil should have:
Brown hair,
An I.Q of between 100 and 110,
And it was clear to see that the education system has significantly decreased in efficiency in regards to teacher/pupil ability over four years.
These results cannot be looked upon as definite however, as my sample (displayed just before the start of hypothesis 2) was not big enough to examine the entire population. To do this I would have needed a sample of at least 300 students, and therefore an awful lot of time.
I found that when I changed to use random sampling as opposed to stratified sampling, the whole process became much easier, with no time wasted working out the correct proportions to make my particular accurate in relation to the raw data. The random sampling was easier, just to create a random sample of students and use them, and it really did eliminate any bias strata, however I am glad that I did use stratified sampling for one of my sample because it has me an insight of using it, and also has given me something to compare the random sampling against.
If I were to do this again, then I would examine my hypotheses in greater detail, as I would group the colours in my statistics in the order of the spectrum. This would allow further investigation and therefore a more in-depth comparison.
My use of cumulative frequency graphs really helped as well, as these allowed me to make comparisons between my data such as finding the median, using box plots to discover the distribution and allowing me to discover the IQR for the data through the usage of quartiles.
Most of my credit has to go to Excel though, as it was most useful during all of my tabulated and graphical representations, along with the calculations I needed.