Next, using the differences I will draw a differences table, which will give us the rules (either being linear and quadratic).
Using these rules I will draw a graph, and if the graph has a straight line then this determines the rule is linear if the line is a smooth curve this determines the rule is quadratic. I will then comment on the graphs, and if the rule is either linear or quadratic I will comment on that too. Next with the rules I will use simultaneous equations, which will then allow me to take my project a step further to work out the answer. After using the rule I found I will make predictions for 6 and 7 stories. In this I will use two new pieces of data. After I have made my predictions I will test these predictions. To do this, I will draw diagram 6 and 7 and then comment on them and explaining that by counting the dominoes I can see that my predictions are correct/wrong e.t.c
I will then write the answer, which I should know easily because of my working during the project. Lastly I will make an extension to my work. I will work through all my steps of work again and work within the framework of the problem or as well as beyond the context of the framework. Hopefully with this work I will achieve the best result.
In the following diagrams I am going to draw S diagrams and work systematically from it being the simplest diagram first of one storey on to more complex diagrams with more stories.
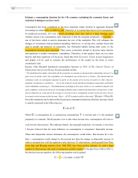
1 Storey
3 dominoes
2 stories
8 dominoes
3 stories
15 dominoes
4 stories
24 dominoes
Results Table
I am now going to record the information I have gathered into a results table, which will allow me to spot any patterns.
In my results table n represents the number of stories and d represents the number of dominoes.
There are two main patterns that I can see here in my results table. The first is that the numbers that are the difference between the number of dominoes are all odd numbers and odd on two each time.
Also, by using the number of stories, and multiply the first story by three and the next by 4 e.t.c we get the number of dominoes.
At this stage I am now going to draw up a differences table to determine whether the rule is linear or quadratic.
5 7 9
1st differences
2nd differences 2 2
As the second row of differences is the same I can see my rule will be quadratic.
I am now going to draw a graph because this will help me to confirm that my rule is indeed quadratic.
We know the rule that we are looking for is a quadratic. All quadratics can be written in the form y= ax2+bx+c. Changing the notation to be consistent with my project my quadratic is:
D= an2+bn+c
Where d= Number of dominoes.
n= Number of stories.
I am now going to use simultaneous equations to find my rule.
an2+bn+c=d
When n=1 a+b+c=3 (1)
When n=2 4a+2b+c=8 (2)
When n=3 9a+3b+c+15 (3)
Eliminate C
(2)-(1)= 3a+b=5
(3)-(2) = 5a+b=7
Eliminate B
(5)-(4) 2a=2 therefore a=1
Substitute a=1 into (4)
3+b=5 therefore b=2
Substitute a=1 and b=2 into (1)
1+2+c=3 Therefore c=0
An2+bn+c=d (dominoes)
1n2(squared)+2n+0=d
n(squared)+2n=d = RULE
Using the rule that I have just worked out I will now make predictions for a domino house with 5 stories and a domino house, which has 6 stories.
My rule is n(squared)+2n=d
When n=5 5(squared)+(2x5)=d
25+10=35
So a domino house with 5 stories will use 35 dominoes.
When n=6 6(squared)+(2x6)=d
36+12=48
So a domino house with 6 stories will use 48 dominoes.
I am now going to test these predictions by drawing a domino house with 5 stories and a domino house with 6 stories and then count how many dominoes are used to build these domino houses in order to see if my predictions are correct.
Here I can see that this domino house uses 35 dominoes, which means my predictions are correct.
6 Stories.