These are my hypotheses:-
- Tall students are heavier than short students.
- Older students are heavier than younger students.
- Students who watch more T.V is heavier then students who watch less.
To prove my first hypothesis, (i.e. tall students are heavier than short students) I will use a sample. I have1500 pieces of data to work with, A 10% sample would be 150 students which is simply too large for me and will consume a lot of time. A 5% sample is about 75 students which is also too large a sample for me. A sample of about 60 will be right so that is what I will use. For the first hypothesis, I couldn’t use a convenience because of the time allotted for me to do this, but if I did do this but the problem with that will be that I would not know the difference between Year 7, Year 8 and Year 9 students as they wear the same colour of jumper. (It will be very difficult for me to collect the data.) I could use a systematic sample but the problem with that could be, for example take a sample of every fifth student, that I came across in the data book, it can be biased if low or high values occur in a regular pattern. I could use a quota sample but that wouldn’t be very much of a random sample because it would be I who would choose the students (from the data book) and this may bias or skew my results, also it is not very reliable. I could also use a cluster sample but this may also be biased because I may end up with only a certain type of people in a group e.g. a whole group of year 7. Although this is very unlikely, it is not a risk worth taking because my results would end up skewed.
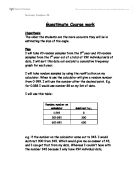
So, in my opinion the best sampling methods to use are the stratified sample for hypotheses 2 and 3 and a random sample for hypothesis 1. This way my results will be more reliable as they won’t be biased or skewed. To use a random sample I will use the random number button on my calculator and then round up the decimal number that is given. For example I would round 37.323 down to 37 and round 37.545 up to 38. I may face a problem in this because if I want, for example, to pick a random sample from a total of 112 it will not be very likely for me to get 112 as all the other numbers as it is the maximum number. So what I will do to solve this problem is if I get a number under 0.5 or over 111.5 I will call it 112.
So, back to my method of supporting my first hypothesis; I will use my secondary sample of 60 students and then plot them onto a graph. I will use them as a control group. Then I will get another sample of 60 Year 7 students from the secondary source provided, that is, the Mayfield school database. I will then plot that data onto a new graph. Then I will find the line of best fit after finding the mean point and then find the equation for that line of best fit and then use it to predict data which will be both interpolated and extrapolated. Then I will calculate the Spearmans Rank Correlation Coefficient to find out how strong the correlation is between the height and weight. If the two correlations are similar then I will continue supporting my other hypotheses using the Mayfield data.
For my second hypothesis, (i.e. older students are heavier than younger students) I will firstly take a stratified sample of students from each year and then select them using the Mayfield data book provided. As the students from all years and of all sexes are already jumbled up, there would be no point in me trying to find a random sample. Instead I could just go down the list and pick, say, the first 15 year 7 students I come across. After doing this I would put all of the data together and find out the mean and standard deviation from each year group. That way, it will tell me if older students are lighter and how far away from the mean the data is spread out. I have chosen to do standard deviation in this because it is a very accurate way of finding out how far away data is from the mean.
For my third hypothesis (i.e. girls are lighter than boys) I will take another stratified sample from each year group of girls and boys and go down the Mayfield data book and again pick out for example, the first 7 girls I come across. This way my data is unlikely to be biased. After doing this I will manipulate the data to create a two-way table, categorising the weights of the girls and boys, into class widths. After this I will find out the frequency- density of the data and create a histogram for both my male and female pieces of data. From this I will draw a distribution curve and see which way more of the data lies. Also from my frequency- density table, I will also work out the cumulative frequency and draw a cumulative frequency graph for that. From the cumulative frequency graph I will find out the upper- quartile, the lower quartile and the interquartile range. Also from the cumulative frequency graph I will draw a box and whisker diagram and compare the weights of boys and girls.