Year 10 students generally over estimate obtuse angles but under estimate acute angles
Year 10 students generally over estimate obtuse angles but under estimate acute angles
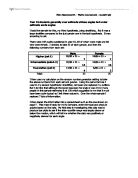
I took the sample for this, my third hypothesis, using stratifying. But it was a large stratifies compared to the just gender one in the last hypothesis. It was according to set.
There were 187 pupils questioned in year 10, 92 of whom were male and 86 who were female. I decided to take 25 of each gender, and then the following numbers from each set:
Male
Female
Higher (set 1)
28/92 x 25 =
7
24/86 x 25 =
7
Intermediate (sets2-3)
50/92 x 25 =
4
54/86 x 25 =
6
Foundation (set 5)
4/92 x 25 =
4
8/86 x 25 =
2
Total: 25 25
I then used my calculator on the random number generator setting to take the above numbers from each set and gender. Using the same formula I used in my second hypothesis I identified, removed and replaced my outliers. But I did find that although the lower boundary for angle 2 was 141.5 many people in this sample estimated it at 120 which suggested to me that it must have been quite typical so I left these values in. Over the whole sample I replaced 7 lots of information.
I then placed the information into a spreadsheet such as the one shown on page ?. This made it easy for me to compare, enter formulas and produce graphs based on the data. My first step in investigating this data was to produce box plots to see if the inter-quartile range was largely above or below the median, which will tell me whether the data was positively or negatively skewed for each angle.