C3 Coursework - different methods of solving equations.
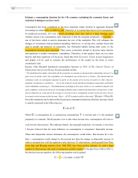
C3 Coursework - Numerical Solutions Decimal Search There a numerous ways to solve a problem and in finding the unknown. Some methods give you the exact and precise answer but usually are harder and more complex. The Decimal search method enables you to get a very close approximate to the real solution but more easily. The way this method works is by looking between two numerical values (for example 1 and 2) and then As a demonstration in applying this method, I will be attempting to solve this equation using the Decimal Search method and going through the method step by step: Below is what this function looks when plotted on a graph: We know that the solution for F(x) = 0 is the point on the X axis where the sign changes from a positive to a negative. So if we zoom in a little bit further, from this graph we can tell where the solution lies, somewhere between 0 and 10 Now that we know the solution is roughly between these two values, I will use excel to solve the problem with firstly taking increments in x, the size of 1. So when I substitute the incremented values of x between -10 and 0 into the equation, I get the following results: x F(x) -1 20 -2 9 -3 0 -4 -13 -5 -56 -6 -125 -7 -226 -8 -365 -9 -548 You can tell that the sign changed between -3 and -4. So I set these as my initial values. The fact that the solution lies between -3 and -4 can

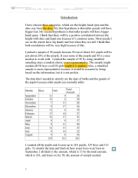
The heights of 16-18 year old young adults varies between males and females. My prediction is that the majority of males are taller than females.
Statistics coursework S1 Task A: Measurements The heights of 16-18 young adults varies between males and females. My prediction is that the majority of males are taller than females. I have decided to take a sample of 100 16-18 young adults from Havering Sixth Form College and measure their heights with a tape measure. My two populations will be male and females and I will obtain 50 male heights and 50 female heights. I have chosen to take a sample of 100 because small sample sizes may give inaccurate results whereas a larger sample size may be impractical and time consuming. Therefore I feel a sample size of 100 will give a efficient set of results and a meaningful conclusion could be deduced. To insure that the data I collected wasn't biased I didn't look at each persons height to ensure that the data I collected was even for both populations and within both populations. Also because height isn't affected by whether you are athletic or not or whether you eat lots or who you are friends with, the data I collected cant be bias for that aspect of my data collection and also I didn't collect my data at a modeling studio, of which nearly everyone there would be over 6ft and would make my data collection bias and unfair. So overall the data I collected wasn't bias and was accurate to use for my investigation. I decided to investigate the difference in heights between

The Gradient Function
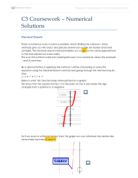
The Gradient Function Aim: To find the gradient function of curves of the form y=axn. To begin with, I should investigate how the gradient changes, in relation to the value of x. Following this, I plan to expand my investigation to see how the gradient changes, and as a result how a changes in relation to this. Method: At the very start of the investigation, I shall investigate the gradient at the values of y=xn. To start with, I shall put the results in a table, but later on, as I attempt to find the gradient through advanced methods, a table may be unnecessary. As I plot the values of y=x2, this should allow me to plot a line of best fit and analyze, and otherwise evaluate, the relationship between the gradient and x in this equation. I have begun with n=2. After analyzing this, I shall carry on using a constant value of "a" until further on in the investigation, and keep on increasing n by 1 each time. I shall plot on the graphs the relative x values and determine a gradient between n and the gradients. Perhaps further on in the investigation, I shall modify the value of a, and perhaps make n a fractional or negative power. Method to find the gradient: These methods would perhaps be better if I demonstrated them using an example, so I will illustrate this using y=x2. This is the graph of y=x2. I will find out the gradient of this curve, by using the three methods -