Henna Night
Henna Night The day had finally arrived. The icy cold wind was blowing so strongly, that everything obstructing was thrown instantly. The tall trees were swaying from side to side, bundles golden, brown and red leaves were falling upon the bare ground. The crumpling sound of the leaves attracted Nadia's attention. She was amazed by the bright coloured leaves, planning ideas for her future art project. Nadia, a sixteen year old had attended a Henna function for the first time. Nadia and her family walked towards the door of the hall, where the function was to take place. It had been a completely new experience for Nadia. Nadia had caught a glimpse of Yasmin walking towards the hall. As Yasmin had entered the room, crowds of people obstructed her view, but Nadia had a clear sight of Yasmin. Yasmin, the bride was walking slowly into the hall, wearing a yellow lehngha (skirt) with glittering golden embroidery. The embroidery was towards the top of the lehngha and at the bottom like a border. Her shimmering top had red and gold coloured embroidery in the middle. She looked like a model posing. At a Henna function it is traditional for the bride to wear the colour yellow or golden. The drole of the drum was getting louder and louder, with the beat gradually getting faster. There were two lines of girls waiting for Yasmin to pass by. They were holding little baskets with party
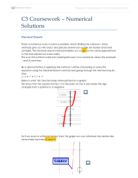
The aim of this investigation is to examine whether or not the number of people per doctor affects a countries average life expectancy.
Statistics.2 - Bivariate Data Ben Ward AIM: The aim of this investigation is to examine whether or not the number of people per doctor affects a countries average life expectancy. The life expectancy of many lesser economically developed countries is lower than that of more economically developed countries. Generally, better-developed countries have a greater doctor to population ratio. So I wish to determine whether this is a factor that affects life expectancy. I choose this investigation, as I'm interested in geography particularly travelling. I plan to take a gap year after my A-levels, prior to university and hopefully visit many areas of the world including less economically developed countries. This led me to an interest in the variation of death rates between countries and I decided to compare this data to the number of doctors per person and to see if this influences the death rate in anyway. DATA COLLECTION: Firstly, I collected a list of all the countries in the world and their doctor to patient ratio. I got my data from a school Atlas I acquired from the college library; I collected the data from the same source as it was obtained in the same year. The countries were listed alphabetically and assigned a number. Using a graphics calculator I generated a random number, using a random function and chose a sample of 50. However, some numbers were generated twice
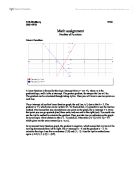
Math assignment - Families of Functions.
Erik Skyllberg NEG 2003-04-03 Math assignment Families of Functions Linear Function: A linear function is formed by the slope-intercept form y = mx + b, where m is the gradient/slope, and b is the y-intercept. The greater gradient, the steeper the line will be. The gradient can be calculated through taking ?y/?x. Then you will have to use two points on each line. The y-intercept of my first linear function graph, the red line, is 2, due to that b = 2. The gradient is + 3, which also can be written 3/1. To find out that, it is possible to use the rise/run method. That means that you already know one point on the graph, the y-intercept + 2. From that point you can go upwards (rise) three units, and one unit to the right (run). You could also use the ?y/?x method to calculate the gradient. Then you take two co-ordinates on the graph. In my example I have chosen to take (-1, -1) and (0,2). I then take (2-(-1)) / (0-(-1)) = 3/1 which gives me the same answer (y2-y1 / x2-x1). In my second linear function graph, the gradient is negative, which means that my line will be moving downwards from left to right. The y-intercept is - 4 and the gradient is - 2. To calculate the slope I use the co-ordinates (-2,0) and (-1, -2). I use the ?y/?x method once again. (-2-0) / (-1-(-2)) = -(2/1). Absolute Value Function: In an absolute value function, the graph is
Describe two applications of linear programming to management problems. What are the main disadvantages of the technique?
(a) Describe two applications of linear programming to management problems. What are the main disadvantages of the technique? When managers relate to the decision-making processes they face a problem of allocating several scarce resources. The opportunity cost of these scarce resources can be determined by the use of linear programming techniques. Linear programming was developed by George B. Dantzig in 1947 as a technique for planning the diversified activities of the U.S Air Force. Linear programming is a powerful mathematical technique that can be applied to the problem of rationing limited facilities and resources among many alternative uses in such a way that the optimum benefits can be derived from their utilization. The main objective of the linear programming problem is maximizing profit or minimizing cost. Applications of the linear programming are numerous in a variety of problem situations such as the blending problem and the product-mix problem. One of the most important applications of linear programming is the formulation of blends which meet certain requirements at minimum cost. Blending problems occur whenever managers decide how to produce a blend out of specified commodities or constituents whose characteristics and costs are given. Therefore the manager's problem is to design a blend that minimizes cost per pound and also satisfies the product

I want to find out if there is a connection between people's IQ and their average KS2 SATs results.
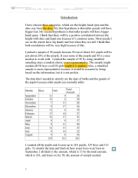
Maths Statistics Coursework Aim: I want to find out if there is a connection between people's IQ and their average KS2 SATs results. I have gotten my data from the internet and I will take what I need to use in my coursework. Hypothesis 1: I predict that the higher someone's IQ is, the higher their average KS2 SATs results will be. Plan and Analysis: I found a sheet of data put onto Microsoft Excel on the internet for a fictional school called Mayfield High School. Even though the school is made up, the data is based on real people and there are 1183 students in all. The data is details of male and Female students in years 7 to 11 e.g. Height, Weight or favourite colour. This data is a secondary piece of data, I had not collected the information myself, and it was already on and Excel worksheet ready for me. Also the data for each individual student that I have is mixed, some information is discrete (favourite TV program or IQ), but some pieces of information are continuous (height or weight). I had decided to see the connection between students IQ and her average KS2 SATs results. To do this I had to take a sample of students out of all the data that I had, for I could not sample the whole population, as there are too many students. I decided that a sample of 50 students was big enough to get a decent and fairly accurate result, but small enough not give me too much

Mechanics Coursework
Mechanics Coursework Scoring a Basket in Basketball Formulating my Model My task is to produce a strategy necessary for scoring a basket in basketball. I shall investigate the effects of throwing the ball at different angles and ascertain the ideal angle for scoring a basket. In addition, I shall investigate what would be the best angle for me to throw the basketball rather than just the basketball player as the angle will be different as I am much shorter than a basketball player. I will model the motion of the ball as it leaves the hands of the basketball player and falls through the hoop. I will model the basketball as a particle. Basketball is a ball game where if a free throw is taken a player will try and shoot a hoop from the free-throw line which is 4.61m from the backboard of the hoop. The centre of the hoop is then 382cm from the backboard. Therefore, the centre of the hoop is 4.22m from the free-throw line. I am taking the height of the basketball hoop as being 3.053m. I am taking the height of the basketball player to be 1.984m. My own height is 1.6m. This diagram of a basketball court has been taken from http://en.wikipedia.org/wiki/Basketball. In order to model the basketball as a particle I have made the following assumptions: * That there is no air resistance. I have made this assumption because the effect of air resistance on the speed of the
There are many ways of comparing the birth rates of countries compared to other countries, and one way may be to look at the life expectancies of the countries.
Statistics Coursework 2 Aim There are many ways of comparing the birth rates of countries compared to other countries, and one way may be to look at the life expectancies of the countries. I believe that there is will be a correlation between the two variables: Average birth rate of a country per 1,000 and Life expectancy of a country. I think that the higher the life expectancy, the lower the birth rate, and vice versa. If there is a correlation, then it will be a negative one, and it also means that by looking at the life expectancy of a country, you may be able to estimate the birth rate of that country. Data Collection I found my data for both, life expectancy and birth rate of 196 countries, from a website, www.globastat.com. The data for each was collected from the same year, 2001, and so is fairly up-to-date reliable, and accurate. My 'population' is of countries in the world. There were a total of 196 countries for both life expectancy and birth rate, and the same countries were found in both lists, therefore making my selection a little easier. I needed to choose a sample from the total, and I chose to use 60 countries for their data. I chose these 60 by a random process: by typing Ran#196 in my calculator, my calculator gave me a random selection between 001 and 196, therefore enabling me to choose my 60 countries with ease. As the process is completely random,

Investigate if there is any correlation between the Death rate of a country (deaths/1,000 population) and the Life expectancy at birth (years).
` Aim: My aim is to investigate if there is any correlation between the Death rate of a country (deaths/1,000 population) and the Life expectancy at birth (years). The Death rate of a country is the amount of people dying per 1000 population in a given year. The life expectancy at birth shows the average number of years to be lived by a group of people born in the same year, if mortality at each age remains constant in the future. It shows the life expectancy on average for the total population for male and females. Life expectancy at birth is also a measure of overall quality of life in a country and summarizes the mortality at all ages. The reason for doing this investigation is that I have seen a lot of documentaries and read a lot of articles in the newspaper which have talked about how countries with higher death rates have lower life expectancies. I will like to prove this theory and see if the data correlates. Data collection: The data I collected was the Death rate of a country (deaths/1,000 population) and the life expectancy at birth (years). I have collected data for these two variables from the whole world. Both my variables are random. So my population is defined as the whole world. I obtained the data from the www.CIA.gov website. I got 200 pieces of data for both of them. So from the 200 I used a sampling method of choosing every 4th country on

Three ways of reading The Bloody Chamber.
Three ways of reading The Bloody Chamber In order to look at The Bloody Chamber as a set of interlinked stories which can be read in a variety of ways, I propose to use the ideas about language and myth as semiological systems that Barthes expounds in Mythologies. A brief account of Barthes views is therefore necessary. Barthes, following Saussure, looks upon a story as comprising a semiological structure, with three terms - signifier, signified and sign. The signifier is the linguistic unit: word, sentence, story. The signified is the thing the signifier refers to, object, thought, concept. The sign is the unity that the signified and signifier constitute for us. Barthes gives the example of someone giving a bunch of roses as a token of their affection to someone. The roses are the signifier, the signified is their passion, and the sign is the unity of signifier and signified, 'passionified' roses, which we grasp in thought. For Barthes, myth as a semiological system constitutes a second order semiological system. That is, in a myth, the signifier, the first tem in the semiology of myth, is already an item which is full of meaning, a sign. The following diagram should help to clarify Barthes point. signifier signified sign SIGNIFIER SIGNIFIED SIGN Here, the first order terms are given in lower case: signifier, signified and sign, and the second order, mythic,

The average pupil.
GCSE Maths Coursework The average pupil The aim of this study is to find the statistics for the average school pupil. This will be achieved by looking at the results of a survey carried out at Jordan Hill comprehensive. Hypotheses: How the education system has changed in its efficiency, over four years. The weight of a pupil will increase with the amount of television watched per week. The hair colour of a pupil will affect their IQ. How I will achieve this? This will be achieved by using samples of the given material. Specifically a sample of 50 people will be used for the first hypothesis, and then a sample of 30 will be used for the next two hypotheses, as to not be too time consuming. I will be using a stratified sample for the first hypothesis, and then a random sample from that point forward. Why am I using Stratified and Random sampling to acquire my sample? From studying the data sheets I have decided to use a stratified sample. I have chosen this method because it would appear to be the most efficient method of sampling in order to tackle this amount of data, and I feel that the sample is plenty large enough for the results to be significant. I have also chosen a random sample because it cannot become bias, if some strata are larger than others. This is also because gender, or age will not affect the two last hypotheses. It will also provide me with