Second Hypothesis: “More pupils in year 7 prefer pop, than year 11 pupils.”
- Firstly I will stratify the amount of year 7 and year 11 students
- Than I will produce a questionnaire which I will distribute randomly to the number of stratified pupils in each year group.
- I will than present the information in graphs and charts to make the data easier to analysis.
Third Hypothesis: “Pupils in year 11 spend more time listening to music than pupils in year 7.”
- I will use the same sample as in the second hypothesis; the questionnaire in the second hypothesis would have already had the question “How much music do you listen to per day?”
- After collecting all the data I would present it on charts and graphs and finally analyse them.
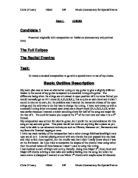
Hypothesis 1:
Prediction:
I think the hypothesis will be true because most girls tend to listen to more popular types of music, whereas boys prefer underground music – which mainly consists of rap.
Results:
First Hypothesis: “Boys and girls generally listen to different types of music.”
Boys Tally:
Bar Chart:
Pie Chart of Boys favourite genres:
Pie Chart of Girls Favourite genres:
Pie Chart of Mixed Favourite genre:
Comment on Hypothesis 1:
My survey results show that the favourite genre for boys is Rock and Rap, which equally got 4 votes from the 15 boys that I surveyed. The Girls favourite genre was Pop, with 5 votes from the 15 girls that I surveyed. However the favourite genre for the overall population of the survey was Pop, this may have been because the 5 votes that it gained in the girls survey. This also shows that the boys overall have a wider range of preferred music whilst the girls preferred mostly the same types of music.
The Hypothesis has also proved to be true because as a whole girls and boys in my survey chose different types of music genres as their favourite. However I am aware that my sample was far too small to represent the whole population of girls and boys.
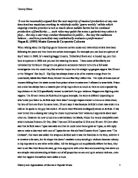
It will be relevant to do a further hypothesis – this is because age can be a factor. For example students in different years may prefer different types of music. The young students may enjoy rap, pop, and other genres of music just to fit into a group, or to become more appealing to student of there age. Whereas an older student has the years to experiment with different forms of music and now has a favourite which they truly love – not just because they would feel welcomed with there peers.
Second Hypothesis: “More pupils in year 7 prefer pop, than year 11 pupils.”
Minimising Bias
In my pre-test I sampled 15 boys and 15 girls at random from the school. However, the school is growing and there are more students in year 7 than in year 11. This means that my sample was biased or unfair. To ensure that students from different age groups are equally represented I need to take a stratified sample.
Here is how I’ll take the stratified sample:
There are 151 boys in year 7 and 457 pupils in both year 7 and 11 (I will only survey these two years because year 8’s and 9’s may have a similar taste to year 7’s and year 10’s may have a similar taste as year 11’s). So 151/457 of the school population are year 7 boys. The same proportion of my stratified sample should be year 7 boys.
151/457 X 30 =9.9.
However it is impossible to sample 9.9 persons, so we round it to the nearest whole number.
I have done the above to get these numbers of stratified members in my survey:
Now I will randomly pick 10 boys and 7 girls from year 7 and 6 boys and 7 girls from year 11. This can be done by using the random button on a calculator as explained in the first hypothesis.
Prediction:
I think the hypothesis will be true because year 7’s will tend to listen to the most popular type of music which is pop. This is because pop is always seen on TV and heard on popular radio stations such as Capital Fm.
Second hypothesis; Results:
Year 7 Boys:
Year 7 Girls:
Year 11 Boys:
Year 11 Girls:
Bar Charts:
Year 7 Boys:
Year 7 Girls:
Year 7 Mixed:
Year 11 Boys:
Year 11 Girls:
Year 11 Mixed:
Comment on Hypothesis 2:
My survey results show that the favourite genre for both year 7 boys and girls is pop. 70% of year 7 boys and 85% of year 7 girls said pop was their favourite music genre. Where as only 16% of boys and 42% of girls in year 7 said pop was there favourite genre.
This shows that my hypothesis is true. Year 7’s do listen to more pop than year 11’s. This could be because students in 7’s tend to listen to a certain type of music (pop) because they will feel more welcomed within there peers. Whereas year 11 students have had the time to experiment with different types of music and have chosen a genre which they really enjoy more than anything else.
However I have taken into account that the preferred genre of music maybe affected by the hours of music you listen to. This is my third hypothesis.
Hypothesis 3:
“Pupils in year 11 spend more time listening to music than pupils in year 7.”
I have used the same people in the survey as the last hypothesis. So this is also a stratified sample of 15 year 7 boys and girls and 15 year 11 boys and girls.
Prediction:
I think the hypothesis will be true because year 11’s may start to listen to music to relieve stresses and strains which they face during their exams.
Results:
Bar chart:
Pie chart – Year 7’s
Pie chart – Year 11’s
Line Graph:
Cumulative frequency:
Inter-quartile:
I could not obtain the inter-quartile range for year 7’s as the mean and median could not be gained – as you can see on the graph.
However the median for year 11’s was 1.4 hours of music per day. The inter-quartile range was 1.9 – 1.4 = 0.5. This shows that there wasn’t a lot of difference between the hours of music listened to by the year 11’s.
Analysis:
The graph for year 7’s shows a negative trend whereas the graph for year 11’s shows a positive trend. This also show that my hypothesis was correct because it does show that more year 11 listen to music than year 7’s
However I have taken into consideration that my sample was very small for all the hypotheses and that next time to improve the results I would sample more people.