Task 3
This table shows that there is a vast difference in answers between the two genders. For example, female's most common largest expense was travelling with 22 answers whereas males answered equipment more often with 10. Also males less common answer was clothing with 4 whereas females chose coaching, equipment and other the least all with 2 answers.
Task 4
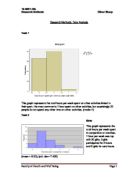
The bar chart is a comparison between male and female responses to how they rated the amount of coaching they received per week. The majority of the boys and girls said it was too much, however more boys than girls said it was too little.
Task 5
This table simply shows the mean, median and mode and standard deviation of the age in months between all the males and females that took part in the survey.
Task 6
Girls
The pie chart shows the girls rating of coaching quality. It shows the majority thought just OK and only 3% thought it wasn't good enough.
Boys
This pie chart shows the males responses. It shows that the majority thought it was OK with 70% and only 22% thought it was excellent.
Task 7
This cross tabulation represents the responses of question "how do you rate the amount of coaching you receive per week?" against "how do you rate the quality of coaching you receive?" OK was the most popular answer for quality of coaching with 25 people agreeing who also answered they had too much coaching per week.
Task 8
This table shows that out of the 75 people questioned 37 of them thought the school was good for sport. Out of that 37 11 of them agreed that it was excellent for playing matches. 18 people had a neutral response, answers split across excellent, ok and not good enough. The remaining 20 responded negatively. The chi-square test is used for estimating how closely an observed distribution matches an expected distribution. In this case backing up the hypothesis.
Task 9
Of 75 people 25 of them were not in their exam year and therefore not taking GCSEs. 10 of these said the amount of coaching received was too little, however 6 said it was too much. 34 people who are in their exam year believed the coaching received to be too much, possibly because they need more time to study for exams and not play sport. This is what the chi-square test is showing.
Faculty of Health and Well Being Page