Aims & Hypotheses
The study aims to investigate whether images aid memory recall.
The hypothesis is (as did Bower, 1972) that participants in condition 1 (involving grid of random words supported by images) would perform better than those in condition 2 (only consisting of random words). My hypothesis is one-tailed; people remember more in aid of visual representation.
The null hypothesis is there will be no difference in condition 1 (involving grid of random words supported by images) and condition 2 (only consisting of random words); this difference is due to chance factors alone.
The level of significance for this study is 5% (0.05) as this is neither to harsh nor too lenient.
Method
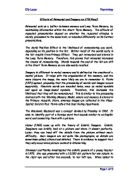
The investigation was a laboratory experiment, in which the independent variable was manipulated to observe effect on the dependent variable under controlled conditions. The investigation used this research method to minimise confounding variables, draw causal conclusions and in addition, investigation/study can be replicated without difficulty.
In this investigation the independent groups design was used; two groups of participants used to investigate two conditions. This particular design was used to avoid order effects and participants guessing the purpose of the experiment.
The investigation used an opportunity sample (people who are easily available) whereas a random sample would need to be drawn from a large population and a volunteer sample can be volunteer bias.
The independent variables (manipulated by the experimenter) were the materials for each condition (random words with images and words without images). The dependent variable (what is being measured) was the recall from each participant. The confounding variables, variables apart from the independent variables that do affect the dependent variables were noise, surroundings, age, participant reactivity, use of words and images. Though, noise and surroundings may be considered as an extraneous variable.
Confidentially is a legal right under the Data Protection Act; this investigation did not record the names of participants; instead used numbers though gender of participants was noted. Participants were given informed consent, allowing participants the right to withdraw if they decide during the experiment that they no longer wish to participate. Participants were deceived about the nature of the study, though all participants were debriefed after the experiment, so such deceptions may be regarded as acceptable and to limit all ethical considerations.
Participation in the investigation may have caused some participants emotional/mental distress (use of words/time limit), though during the debrief participants are given the opportunity to discuss their feelings.
20 participants were used for conducting this research study, 10 were males and 10 were females aged from 16-25 gained through opportunity sampling. There were two groups/conditions of 10 (5 males, 5 females).
All apparatus/materials used were two sheets of paper with a grid of 20 random words and one of the sheets; words were supported by an image. The standardised instructions, informed consent letter, debrief, answer sheet (identical to word sheet, with grid but no words/images and also to indicate age and gender) and a stopwatch to measure 1 minute for participants to memorize words.
Apparatus/materials found in the appendices (1-7).
- 20 participants were used for conducting this research study, 10 were males and 10 were females aged from 16-25 gained through opportunity sampling. There were two groups/conditions of 10 (5 males, 5 females).
- The experiment took place in a natural setting (for students), a school science laboratory.
- A grid (4x5) with 20 random words and another grid with the same 20 random words but supported by images.
- Those in condition 1 were given the grid in which words were supported by images and condition 2, given grid consisting of only words.
- Researcher/experimenter had to limit speech as much as possible therefore participants were given standardised instructions, after reading and signing the statement of informed consent, which allowed participants the right to withdraw during the experiment.
- Participants were given 1-minute to memorise as many of the 20 words.
- After the 1-minute, grid of 20 words was removed.
- Participants were presented a blank grid (same grid as the 20 words grid but blank spaces) on which they had to recall as many words, with no time limit.
- After recalling as many words, participants had to indicate gender and age.
- Participants were also debriefed after the experiment informing them of the nature/purpose of the experiment.
Controlled variables were the words used, room and time for participants to memorize the words. The investigation used standardised procedures a form of experimental control to ensure that confounding variables are eliminated. Set of procedures that are the same for all participants; which can enable replication. Standardised instructions (control of investigator effects) were used; a set of instructions that are the same for all participants to avoid investigator effects.
Standardised procedure and instructions found in the appendices (4 & 5).
Results
Measures of central tendency are quantitative ways to describe the middle of a distribution of scores. There are three common measures of central tendency: mean, median, and mode. Calculations can be found in the appendices (18 & 19).
The mean refers to a numerical average of the scores. Adding all the scores and dividing their sum by the number of scores obtain the mean. Condition 1 on average (mean), participants recalled 14.1 of the words and 12.6 in Condition 2. This indicates that there is a better recall when words are companied by visual aid and supports the experimental hypothesis. The mean is a sensitive measure since it takes into account all values though it can be ambiguous with extreme values.
The median is simply the middle score when all scores are placed in ranked order. The median for Condition 1 is 14.5 and 13.5 for Condition 2. The median shows that the most number of words were recalled in Condition 1 supporting the experimental hypothesis. Extreme scores don’t affect the median however it does not take all values into account.
The mode is the most often occurring score. There was no common number in Condition 1 and 16 were the most occurring score in Condition 2. The mode is a figure, which actually does occur, in a given sequence, which may not be true of the other two measures of central tendency though it has its limitations when there are only few scores representing each value.
Measures of dispersion measure how spread out a set of data is. Range is the difference between the highest and lowest data element. The range for both Conditions is 11 indicating the data for both conditions are equally spread out, although this form of dispersion is not very precise since it only takes into account the highest and lowest value.
Standard Deviation is a measure of the dispersion of outcomes around the mean (or expected value), used to measure total risk. It is the square root of the variance. Data in Condition 2 (3.9) is slightly more spread out than data in Condition 1 (3.6).
Condition 1: (to the nearest whole number)
68.26% of all scores lie between 10 and 18
95.44% of all scores lie between 6 and 20
99.74% of all scores lie between 0 and 20
Condition 2: (to the nearest whole number)
68.26% of all scores lie between 8 and 16
95.44% of all scores lie between 4 and 20
99.74% of all scores lie between 0 and 20
The standard deviation is a much more reliable measure of dispersion since it takes into account all scores in a set of data. The standard deviation for condition 1 is 3.6 and 3.9 for condition 2, showing scores for condition 2 is more varied. Although scores for condition 1 are closely arranged around the mean of 14.1 demonstrating results for condition 1 (less varied) are somewhat more reliable than for condition 2.
Standard Deviation table/calculations can be found in the appendices (22).
The Mann-Whitney U-test is a non-parametric method used to assess whether two samples of observations come from the same distribution. It requires the use of ordinal data, making it the most suitable test to use.
(Observed Value) New Value of U = 35
Critical Value of U = 23
Level of Significance: 5% (P = 0.05)
The observed value (new value of U) is greater than the critical value. The probability of these results occurring through chance would have been greater than 5%. In this case, the null hypothesis is accepted and rejects the experimental hypothesis.
Calculations and table can be found in the appendices (20 & 21).
Discussion
The investigation into whether images aid memory recall has been fairly successful. The experimental hypothesis: participants in condition 1(words with images) would perform better than those in condition 2 (words without images), has been rejected therefore the null hypothesis: there will be no difference in condition 1 (involving grid of random words supported by images) and condition 2 (only consisting of random words) has been accepted.
Only to some extent from the line graph (Condition 1 vs. Condition 2), can we say condition 1 (words with images) recalled more words than those in condition 2 (words without images) because the line for condition 1 is generally above the line for condition 2 and this fairly supports the experimental hypothesis.
The results measured using central tendency and measures of dispersion moderately support the experimental hypothesis. The mean and median for condition 1 (14.1 & 14.5) was greater than of condition 2 (12.6 & 13.5) indicating that there is a better recall when words are companied by visual aid and this supports the experimental hypothesis. The range (11) illustrated that data for both conditions were equally spread out, which does not necessary support the experimental hypothesis. Standard deviation, a more reliable measure of the dispersion than range has shown data in condition 2 (3.977715704) is slightly more spread out than in condition 1 (3.604010112).
Descriptive statistics (numerical & graphical) have illustrated that condition 1 (words with images) performed better and this supports the experimental hypothesis. Not only do the numerical statistics support the hypothesis but the results are fairly pronounced, simply by looking at the line graph (graphical statistics); there is definitely a difference between both conditions although the Mann-Whitney U-test shows this to be below the level of significance.
Inferential statistics, which enable us to draw clear conclusions about the likelihood of the hypothesis being true, is evidence for accepting the null hypothesis. The implication of the results measured using a non-parametric method, The Mann-Whitney U-test clearly shows that at the significance level of 0.05, the results were very likely to have happened by chance. Though the observed value, 35 is greater than the critical value of 23 but only by 10.
Comparatively, the findings of this study support previous theory and research but also are contrary to them.
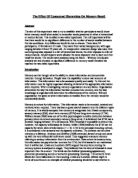
Bower, 1972 imagery recall experiment found that participants, who used imagery, recalled 80% of the words compared to only 45% by the non-imagers. In this investigation, participants in condition 1 (words with images) recalled 70.5% of the words compared to 63% by the non-imagers. My investigation does support Bower’s findings, since there is a difference however the differences between the two conditions is not significant.
Previous research does suggest that data in STM is stored in an acoustic manner this was demonstrated by Conrad (1964). Illustrating people may not always use visual codes to remember data and this supports the null hypothesis; in addition Baddeley’s (1966) study suggests that data is also stored semantically and this again illustrates that people may not always use visual codes.
A possible problem with this experiment is the experimental design which lacks ecological validity and also does not account for individual differences. The study used independent groups, which meant it lacked control of participant variable and needed more participants. A matched participant design could have been used instead to deal with participant variables as participants are matched on key variables such as age and memory ability.
Another problem of the study was the sample size. The study only used 20 participants, a small sample; therefore findings cannot be generalised to the rest of the population. So, a larger sample size of 50+ would be more representative and can be generalised. In addition, the investigation used opportunity sampling, which is very biased, and again it cannot be generalised. Random sampling would be the best method to select participants since it is potentially unbiased.
An additional problem was the images used; some of the images were cartoon images (i.e. bible & pizza) and others were actual photographs (real life images, i.e. greenhouse). This may have been a problem since real life images may possibly be easier to remember than cartoon images or vice versa. To resolve such problem, would be by using only cartoon images alone or only real life images.
The recall between genders may have wider implications: on the whole men have performed better than women, when studies have shown women should perform better than men. For example; women perform better than men in tasks such as verbal learning remembering tasks, name face association, and first last name associations learning (Larrabee and Crook, 1993). Ideas for a follow up research study is the effects of gender recall and discover if there is a significant effect for the sex of a participant on the types of gender associated images recalled and to compare the effects of visual and semantic codes in depth.
There is evidence to illustrate that people do remember more with the aid of visual representation and evidence to illustrate people remember more without any visual representation. This itself suggests people do remember data and information differently (individual differences), i.e. acoustically, semantically. Therefore it is important to recognize these findings as they have strong insinuations for its involvement in everyday life, for example with teaching, revision and marketing.
References & Bibliography
Atkinson, R.C. & Shiffrin, R.M. (1968) Human memory: A proposed system and its control processes. In K.W. Spence and J.T. Spence (Eds.), The psychology of learning and motivation, vol. 8. London: Academic Press
Baddeley, A. D. (1966) Encoding in LTM: The influence of acoustic and semantic similarity on long-term memory for word sequences. Quart. J. exp. Psychol., 18, 302-9
Bahrick, H. P. (1975) The nature of LTM: ‘Fifty years of memory for names and faces: A cross-sectional approach’, Journal of Experimental Psychology: General, vol. 104, pp. 54-75
Bower, G.H. (1972) Mental imagery and associative learning: In L. Gregg (Ed.), Cognition in learning and memory, 51-88
Brandimote, M. A. (1992) Visual Codes: ‘Influence of short-term memory codes on visual processing: evidence from image transformation tasks’, Journal of Experimental Psychology: Learning, Memory and Cognition, vol. 18, pp. 157-65
Conrad, R. (1964) Encoding in STM: Acoustic confusion and immediate memory. Brit. J. Psychol., 55, 75-84.
Larrabee, G. J. and Crook, T. H. (1993) Gender and Recall: Age of incidental recall a simulated everyday memory task. Journal of Gerontology: Psychological Sciences, 48(1), 45-47, 1993
Miller, G. A. (1956) Seven plus or minus two: ‘The magic number seven, plus or minus two: Some limits on our capacity for processing information’, Psycholocial Review, vol. 63, pp.801-93
Appendix
Grid of 20 Words (with images) 1
Grid of 20 Words (without images) 2
Answer Sheet 3
Standardised Procedures 4
Standardised Instructions 5
Written Debriefing Form 6
Statement of Informed Consent 7
Raw Data inc. Pilot Study (answer sheets) 8-16
Raw Data (results table) 17
Condition 1 – calculations of central tendency & range 18
Condition 2 – calculations of central tendency & range 19
The Mann-Whitney U Test calculations 20
The Mann-Whitney U Test table 21
Standard Deviation calculations/table 22
Revised Edition Psychology AS – Mike Cardwell & Cara Flanagan