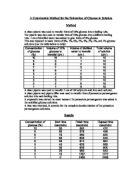
- Using the syringes we made dilutions of the glucose solution. We did this for 0.1g, 0.2g, 0.3g, 0.4g, 0.5g, 0.6g, 0.7g, 0.8g, 0.9g and 1g. (Glucose per 100cm3 distilled water).
- Then the results of the complete decolourisation will be recorded on tables and plotted on an assay curve.
- Adding 2cm3 invertase concentrate to 100cm3 of sucrose solution and stir the mixture will carry out phase 2 of the experiment. (Put the mixture in a water bath)
- Then mark eight test tubes with the figures as follows, 1minute, 2 min, 3min, 4min, 5min, 10min, 15min and 20min.
- After each minute allocated time record how long it takes the solution which contains 10cm3 sugar solution, 5cm3 sulphuric acid and 2cm3 potassium manganate to become colourised in each test.
- Then the results of phase tow of the experiment will be recorded and plotted on a graph.
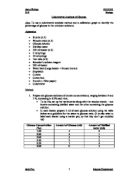
Equipment list:
Phase 1:
- Test tubes * 12
- Three 10cm3 plastic syringes
- 150cm3 glucose solution
- 60cm3 1m sulphuric acid
- 30cm3 0.01m potassium mangante solution
- 150cm3 distilled water
- Beakers
- Test tube racks
- Stop watch
Phase 2:
- Invertase concentration
- 100cm3 sucrose solution
- 20cm3 0.01m potassium mangante
- 50cm3 1m sulphuric acid
- Two 10cm3 plastic syringes
- Eight test tubes
- Test tube rack
- Beakers
Fair testing
In order for the experiment to be fair there have to be three types of variables that need to be taken into consideration. These are the independent variables, dependant variables and the fixed variables.
Independent variables- in order for the experiments to be fair the reducing sugars used have to be measured accurately and you have to be able to put the same amounts in every test tube otherwise the procedure is not accurate. Due to the fact that we are controlling these variables like the reducing sugars the measurements of the sugars have to be accurate.
Dependant variables- this is another area of the experiment where inaccuracy can occur. The dependant variables in this experiment is the time it takes the solution to decolourise. In order for the experiment to be fair the point of decolourisation has to be defined. This can be done by using a white piece of paper and putting it behind the test tube and compare the solution to the paper.
Fixed variables: in order for the experiment to be fair these factors need to be taken into consideration. Temperature, volumes of sulphuric acid, volume of potassium mangante and the glucose and water. The volumes of the sulphuric acid and potassium mangante have to be taken accurately for the experiment to be fair. The timing of the stopwatch also has to be accurate. All these factors need to be controlled if the experiment is to be fair.
The main observations in this experiment are the colour changes from purple to clear. This will be done with the naked eye and it is in this area where faults in accuracy are most likely to occur. To stop inaccuracy the introduction of white paper behind the test tubes can help determine when the solution has decolourised.
The measurements of the results will be changed from the numerical numbers received on the stopwatch to seconds. This will be done for both phases
In order to make the results more accurate and determine whether the solution has decolourised the use of a calorimeter can help the accuracy of the results. This has it up sides but also its down sides because if the use of the calorimeter were to occur than every solution would have to be carried out in the cuvetts. This would be hard as they are very small and all the amounts of various sugars and chemicals would have to be changed to fit into the cuvetts. Another area in which faults might occur is the readings of the meter. If there are scratches on the cuvetts it can change the reading on the calorimeter.
A colorimeter is a machine that is used to see how much light can pass through a liquid. It shows how much light is being transmitted through a sample of liquid. As the number of cells gets higher, less light will be transmitted through the sample. Special thin walled test tubes are used in the colorimeter so that they do not affect the amount of light passing through the sample.
The method used to obtain the results in the experiment is very good for the facilities available in an A- level biology course. By doing this method we can collect a detail amount of results for both phases. The chemicals used in this experiment are available easily. We have used a variation in amounts e.g. for phase one we used solutions of glucose from 0.1g to 1g. This will allow us to get enough data for the analysis stage. This is the same for phase two, as we will collect data from 1minutes to 25minutes. Due to the range of figures used there should be enough results to obtain a graph and justify the results.
Data collection method- the data collection will be presented on tables and graphs. The collection of the data will be recorded as seconds. The use of a white paper background will be used to determine whether the solution has decolourised and at that point of decolourisation is when the stopwatch will be stopped and the data will be recorded on a table. The table will have the various concentrations of glucose for phase one along the top and the times of decolurisation along the sides. The same procedure will occur for the data logging as phase one except along the top will be the various time of the concentration.
Due to the lack of time in the double lesson to contain all the results the use of concurrent time recording will be done so that all the results can be recoded and finished in the time allocated. If this process is to occur the experiment needs to be organized well, therefore the equipment needs to be set out accurately and efficiently.
Data Analysis:
To analyse the data of both phases of the experiment the data will be put into graphs. By plotting the data on the graphs we can work out the concentration of the mystery substance by using the curve in the assay graph. By plotting the graph for phase to we can then produce a gradient line. This will then therefore allow us to work out the rate of enzyme activity.
This is what is predicted for the graph of phase 1:
1) Assay Curve
2) This is the prediction of the graph for phase 2.
Line of Gradient
3) by using the line of gradient form the graph above we can then work out the Rate of enzyme activity.