Introduction
Background Information
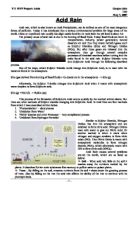
Acid rain causes damage to limestone bulidings. Scientists are concerned that increased air pollution may cause an increase in the concentration of acid in the rain. If this is the case then it would increase the damage done to limestone bulidings.
Acid rain is caused when we burn fuels. When we burn these fuels we make a gas called sulphur dioxide. This gas goes into the air. The sulphur dioxide reacts with the oxygen and then dissolves inot droplets of rain. This then makes an acid called sulphuric acid. Eventually, the acidic droplets in the clouds fall as rain.
When acid reacts with limestone the acid eats away at the limestone.
e.g limestone statues loose their features becasue of the acid eating away at them.
Carbon + Oxygen Carbon dioxide
atom molecule molecule
Sulphur + Oxygen Sulphur dioxide
atom molecule molecule
The question I want to find the answer to is 'What causes acid rain'?
Detailed Method
First, I have to fill up a tub with water. I then get a clamp and clamp stand and a measuring cylinder. I fill the measuring cylinder with water to the very top. I then put my thumb or hand over the cylinder to stop water getting out. I put the cylinder upside down in the water tub making sure I dont let any oxygen get out. I keep the cylinder staying upside down by putting it in the clamp and winding the clamp tight but still keeping the cylinder straight. The clamp goes attaches tot he clamp stand. I can adjust the where abouts the clamp will go on the stand so it will keep the cylinder under water but leaving a gap from the bottom of the tub to the cylinder.
I will then get a boiling tube and a delivery tube with a cork at the end of it. The boiling tube will stand in a tube stand. I will put the end of the delivery tube down under water and up into the cylinder. I will fill the boiling tube up with different concentrations of hydrochloric acid. I then get a stop clock. Next, I measure out 5g of limestone. I put the limestone into the boiling tube and put the cork and stop clock on straight away. I will then time how long it takes to get to the hundred mark on the measuring cylinder.
Equipment Used
* Measuring cylinder
* Clamp
* Clamp stand
* Boiling tube
* Plastic box
* Stop clock
* Delivery tube (with cork)
Chemicals Used
* Hydrochloric acid (different concentrations)
Safety
* If you have long hair then tie it back
* It is essential to wear goggles
* If you get a corrosive or dangerous chemical on you then rinse it off straight away.
Fair Test
To make it a fair test we only need to change one thing. That is the concentrations of Hydrochloric acid. Everything else will has to be kept the same or it wont be a fair test and could cause odd results. The factors I will not change are:-
* the volume of water in the measuring cylinder
* mass of limestone
* size of limestone pieces
* temperature
I will also do each test twice to make sure I have sensible results each time. I know I will have done a fair test, because I will have sensible results and my 2 results for each concentration of acid will follow a considerable pattern.
Background Information
Acid rain causes damage to limestone bulidings. Scientists are concerned that increased air pollution may cause an increase in the concentration of acid in the rain. If this is the case then it would increase the damage done to limestone bulidings.
Acid rain is caused when we burn fuels. When we burn these fuels we make a gas called sulphur dioxide. This gas goes into the air. The sulphur dioxide reacts with the oxygen and then dissolves inot droplets of rain. This then makes an acid called sulphuric acid. Eventually, the acidic droplets in ...
This is a preview of the whole essay
Background Information
Acid rain causes damage to limestone bulidings. Scientists are concerned that increased air pollution may cause an increase in the concentration of acid in the rain. If this is the case then it would increase the damage done to limestone bulidings.
Acid rain is caused when we burn fuels. When we burn these fuels we make a gas called sulphur dioxide. This gas goes into the air. The sulphur dioxide reacts with the oxygen and then dissolves inot droplets of rain. This then makes an acid called sulphuric acid. Eventually, the acidic droplets in the clouds fall as rain.
When acid reacts with limestone the acid eats away at the limestone.
e.g limestone statues loose their features becasue of the acid eating away at them.
carbon + oxygen carbon dioxide
atom molecule molecule
sulphur + oxygen sulphur dioxide
atom molecule molecule
Basic Method
A single trail of the experiment will be carried out by getting a plastic tub filling it with water. Putting a measuring cylinder upside down in water and attaching it to a clamp which will be attached to a clamp stand. I will get a boiling tube and fill it with different concentrations of hydrochloric acid. Next, I will put a delivery tube down under the water and up into the cylinder. I will weigh out 5g of limestone. I will get a stop clock. I then put the limestone into the boiling tube put the cork and timer on straight away. I will time how long it takes for oxygen to get to the 100 mark in the measuring cylinder.
The concentrations of hydrochloric acid used will be:- 0%, 8%, 12%, 16% and 20%.
Purpose
The purpose of this investigation is to find out what causes acid rain. I will also try and find out how to solve the problem. I will find out the rate of reaction and plot these results on a graph.
Factors
The factors which could affect the rate of reaction are:-
* Temperature of the room - I am doing all my experiments in the same room throughout so the temperature of the room should not differ.
* The volume of hydrochloric acid - I will make sure I measure out the acid properly and I am doing each test three times so I will notice a difference between the results if a problem occurs. If the test goes wrong I will do it agian to make sure I have a sensible result for all 3 tests done on the concentration.
* Mass of limestone- I will make sure I weigh out exactly 5grams of limestone.
Prediction
I predict that the higher the concentration, the faster the rate of reaction. I will expect each concentration result to get higher as the concentration gets higher. The 3 results for each concentration will be sensible and will be close together.
Explanation
I expect my results to follow the pattern I have predicted because I have used small chips. Smaller chips will react faster than bigger ones because there will be more collisions between the acid particles and the samller chips. The surface area will be greater for the samller chips the collide around. Therefore, the higher concentration of hydrochloric acid the more acid particles there will be to react with the smaller chips making more collisions between them. The smaller the chips, the more collisions between the chips and the acid molecules. With this explanation, I think that if the chips I use are quite small and if I keep getting a higher concentration everytime, then the reaction will get faster and the rate of reaction will be higher.
Preliminary Work
During my preliminary experiment I used the following concentrations of hydrochloric acid:-
* 0%, 8%, 12%, 16% and 20%
The results I got from my preliminary experiment influenced me because they helped me decide what decisions to make for my final experiments and they also showed me what changes I should make to make sure I get sensible and that it is a fair test. From my results I decided that there is no point in me doing the 0% concentration experiment because during this paticular concentration experiment nothing happened and I did not get any results for it.
The range of concentrations(cm3) I decided to use are:-
* 8%
* 12%
* 16%
* 20%
I decided not to do 0% concentration, as it took too long to react and this wasted my time.
Volume of 2M hydrochloric acid Volume of distilled water (cm3)
(cm3)
0% 20cm
8% 12cm
12% 8cm
16% 4cm
20% 0cm
Obtaining
Results
Theses are the final averages results of time (s) it took to collect 100cm3 of gas from trial 1 and 2:-
4% concentration of hydrochloric acid
Trial 1- 116 seconds
Trial 2- 140 seconds
Average= 128
The averages from trial 1 and 2 are quite wide. Although, my actual results on the table show that trial 1 and 2 results are very close together.
8% concentration of hydrochloric acid.
Trial 1- 61 seconds
Trial 2- 61 seconds
Average= 128s
The averages from trail 1 and 2 are spot on. This was because the results were more or less the same for both trials.
2% concentration of hydrochloric acid.
Trial 1- 46 seconds
Trial 2- 47 seconds
Average= 61s
These results for trial 1 and 2 are nearly the same. The results were also close together from both trials.
6% concentration of hydrochloric acid.
Trial 1- 36 seconds
Trial 2- 33 seconds
Average= 46.5s
The average shows a sensible result.
20% concentration of hydrochloric acid.
Trial 1- 30 seconds
Trial 2- 29 seconds
Average= 34.5s
This average shows a sensible result because the trial results are basicallly the same.
All of my experiments went well apart from one. The first problem was with the 12% result as I forgot to turn on the timer for trial 2. This mistake meant that I had to do that whole experiment again, but in the end I got a good result. I am happy with my results.
Analysis
Averages
4%= 128 seconds
8%= 61 seconds
2%= 46.5 seconds
6%= 34.5 seconds
20%= 29.5 seconds
Conclusion
The results show that the higher the concentration the faster the rate of reaction. The time it takes for the water to collect the gas quickens as the concentration gets higher.
The graph shows that all my results go up in quite a steep, steady line. It also shows that all my results are in line and in pattern. I have no anomonous results. This shows that my results were sensible and acceptable. It also shows that I have done my tests fairly and correctly.
Explanation
The lines on the graph follow the pattern I have described because they all go up steadily. They all start off quite slow as it takes a few seconds for the reaction to speed up. It gets slower as the concentration gets lower. All my results end at 100(cm3). As the concentration gets higher the faster it is at reaching 100(cm3) on the graph. The lines also get steeper and the plots of the graph get wider. This is because the reactions have got faster so it has distilled more water as it reaches each time interval. The lower the concentration the more plots on the graph there are. This is because the reaction is slower so it distills the water slower so it reaches a lot more time intervals before it reaches 100(cm3).
Discussion
The curves get steeper as the concentration gets higher. In the 20% line, the line is almost vertical. The 8% line is the longest line and it is a lot less steep and it has a gradual rise and there are a lot more plots on the the line than any other line. The things the graph lines all have in common is that the all start and end at the same point. The difference between all the lines is that they all get to 100(cm3) at different times. Also, the lower the concentration the more plots are put on the graph. There is enough of a trend to say that my prediction was right. I predicted that the higher the concentration the faster the rate of reaction. This prediction is correct because on the graph and my results show that the higher the concentration the faster the rate of reaction or the quicker it takes for it too collect the gas.
There is 'daylight' between all the lines on the graph. Two of the lines cross. The 20% concentration and the 16% concentration. My prediction is supported by the graph and results. The results and graph clearly show that the higher the concentration the quicker it takes to get to 100(cm3).
Evaluation
The method I used was good because it gave me the results I needed. It also meant I was able to be exact with my results and make sure they were done properly.
I thought my results turned out very well. They were all sensible and they all matched my prediction. My only doubt would have been the 8% concentration because it seemed that trial 1 and 2 were quite far apart, compared to the rest of the trial 1 and 2 averages for the other concentrations. However, the results were very close together so I am not sure why the two are so widely spread.I dont think this will be a problem with ym graph and I dont think my experiments were affected. The other trials for the other concentrations were either the same as each other or they were very close together, so in a sense trial 1 and 2 for 8% did not follow a specific trend that all the other concentrations did. I could tell that all the other results followed a trend because as the concentration got higher the average got lower showing it was quicker for the line to reach 100cm3 and to collect the gas in the experiment.
I think the method used went generally well. Although, there are two things I would have liked to change or be improved. Firstly, I think that having to put the stop watch on straight away and put the cork on basically at the same was quite difficult. I did do it with someone else but I thought it made it difficult to get the time accurate. The second thing would have been putting the cylinder under the water. I didn't know weather the cylinder had kept all its water in or if it hadn't. I think these two things could have affected my experiment. I think to help with cork and timer problem would to work as a three so that someone can put in the chips to the acid, one to put the cork on and the other to start the timer. To improve the cylinder, i think I should have put on a cork to stop water escaping.
I think my evidence is reliable. I think that there were certain limitations and weaknesses in the method that could have affected my experiment and results. These weaknesses/limitations could have stopped me from getting accurate results. The only two things I would have to say would be putting the measuring cylinder underwater without letting any oxygen or water escaping. The other would be trying to put the cork and timer on at the same time. However, I do think my results are reasonable and sensible, as they all follow a pattern and the experiments support my prediction. I think my results are sufficent enough for me to be sure about my conclusion because all my results were either the same as both trials or only 1-3 away. I think the results were accurate enough for me to say that my results and overall experiments went well and sensible and reliable. There was only one anomalous result. This was on the 12% concentration line on the graph. I think this point did not stick with line as it would have made an odd line. If I had included that point the line would not have been a smooth curve.
I could extend my investigation further to provide extra information about how changing the concentration of acid rain affects the rate of reaction with limestone by finding out more detailed information as to why acid rain is formed. I could also change the factors of my experiment. I could do all my experiments again in different places so I could see if the temperature of enviroment around the experiment make any difference to my results. I could compare the different results from the different places. This could help me find out if the temperature or other conditions affect the rate of reaction. I would then analyse and evaluate my results all over again. I would then produce a graph and table to show my results and findings.