Other methods
- Using the Half-life values
A Concentration – Time graph has to be plotted for each experiment. The successive half-lives are then calculated, where the half-life is the time taken for the concentration of the species to fall from any chosen value to half that value. The following observations determine which order of reaction is present:
-
Half-life is equal to zero – Zero Order reaction
-
Successive half-lives are the same – First Order reaction
-
Successive half-lives increase – Second Order reaction
Although the use of half-life is a possible method, this is both time consuming and requires a high degree of accuracy. However, comparing the constructed Initial rate of reaction – Concentration graphs with standard graphs is quicker and produces clearer results.
References: - Essential A2 Chemistry for OCR by Ted Lister and Janet Renshaw - pages 99, 100, 101, 102 and 103
- http://www.avogadro.co.uk/kinetics/rate_equation.htm
- Chemistry 2 by Brian Ratcliff and Helen Eccles – pages 108, 109 and 110
- http://www.steve.gb.com/science/kinetics.html
Prediction: The greater the concentration of HCl or Na2S2O3, the faster the rate of reaction, meaning that less time is elapsed before the cross disappears from beneath the solution.
Hypothesis: The greater the concentration of either species, the more particles there are in a solution. Therefore, collisions become more likely. More collisions take place, leading to a faster rate of reaction.
Preliminary Test
A preliminary test involved the teacher carrying out the experiment and me watching this. This enabled me to understand exactly how to carry out the experiment and also determine ways in which I would carry out the experiment more accurately. This is vital in order to produce accurate results so that reliable conclusions can be made.
Below are the results:
Observations made from the teacher’s experiment
Numerous observations were made from the teacher’s experiment. He did not initially clean out the beakers and measuring cylinders before carrying out the experiment. This meant that he couldn’t claim to be carrying out a fair test, because foreign ions may have damaged and manipulated the results. In addition, when producing the different volumes, the teacher was extremely carefree by not crouching on one knee to get a level table view of the measuring cylinders or double checking the volumes used. This obviously affected the precision at which he carried out the experiment. Also, he didn’t test the stopwatch before using them in the experiment which could have meant that false times were produced. The teacher’s experiment has also allowed me to realise that there limitations not only on the amount time available, but also the amount of each species that is available.
Finally and most importantly, the teacher didn’t use varying concentrations, or repeat the experiment. By not doing this, the teacher was unable to fulfil the aim of this investigation as the affect of concentration on the rate of reaction cannot be determined, and by not repeating the experiment, average readings, which are more accurate than single readings, were not calculated. Again, this obviously affected the both the reliability and accuracy of his experiment.
Preliminary test conclusions
The preliminary test has enabled the following conclusions to be reached about the experiment, which will be utilised when I carry out the final experiment, in order to improve accuracy:
- Need to change the concentration of each species separately
- Need to crouch on one knee to get a level table view of the measuring cylinder, as a high degree of accuracy is required when producing the different concentrations
- Need to double check the volumes used
- Experiment needs to be carried out slowly
- Need to undergo more than one trial for each concentration
- Stopwatch needs to be tested before use
- High degree of accuracy is required when producing the different concentrations
- Cross constructed needs to be extremely large and clear
- Need to know which apparatus is used for each reactant to avoid confusion
- Working space needs to be clear before carrying out the experiment
Method
Equipment required:
-
3 measuring cylinders – to accurately measure the volumes of HCl, H2O and Na2S2O3
-
0.4 mol dm-3 Sodium thiosulphate – reactant needed at different concentrations
-
2 mol dm-3 Hydrochloric acid – reactant needed at different concentrations
- Distilled water – used in order to dilute HCl at different concentrations
-
Conical flask – to dilute the HCl with H2O
- Beaker – to contain the solution of the reactants
- A4 paper – to be placed beneath the conical flask before the reaction starts
- Marker pen – to construct a large cross on the piece of paper placed beneath the conical flask
- Stopwatch – to time how long it takes for the cross to disappear
Safety Precautions:
- Wear safety goggles – provides protection for eyes
- Wear lab coat – provides protection for clothing
- Wash hands with soap after experiment is finished – in order to remove traces of the chemicals to avoid contamination e.g. of food
- Ensure that work space is clear – in order to prevent human concentration being disturbed during the experiment
- Ensure that equipment containing liquids, e.g. conical flasks, are well away from the edges of the table – in order to prevent the smashing of glassware
- Being as careful as possible when handling chemicals – in order to avoid the spilling of chemicals
- Ensure that surfaces are dry by wiping away any liquids
- Make sure that unwanted products are disposed of in a sink – to prevent accidentally reusing the solution
Ensuring a fair test
In such an experiment, it is vital that a fair test is maintained. This enables accurate results to be produced, and both an accurate and reliable conclusion to be drawn. The following methods are going to be used in order to ensure a fair test:
- Using only one variable per test e.g. changing the concentration of sodium thiosulphate but keeping the concentration of hydrochloric acid constant – this enables an accurate conclusion to be drawn
- Glassware containing the solution will be washed both before use and after measurements – this ensures that results do not become damaged by eliminating ions from the previous trials
- Three trials will be undertaken for each mixture – this enables an accurate average time to be calculated, which reduces the effect of any anomalous results
- Using separate glassware for different reactants – this ensures that the reactants aren’t mistakenly mixed together which would produce flawed results
- Resetting the stopwatch after each use – prevents accidentally writing down the incorrect time after the cross disappears
-
Keeping the total volume of the solution at 75cm3 as different volumes could produce different results
- Starting the stopwatch as soon as the reactants are in the beaker
Producing different concentrations
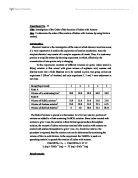
In order to determine how each species affects the reaction rate, the concentration of each species needs to be changed, making this a variable. This is achieved by altering the volume of each reactant. However, to accurately determine the effects of concentration, only one reactant can be a variable at a time. By not doing this, the concentrations of both Na2S2O3 and HCl are variables, then their effects can not be determined, as it becomes difficult to distinguish between the two variables.
Therefore, in the experiments, the following concentrations will be used, by use of the following volumes:
Experiment 1
Total volume = 75 cm3
In Experiment 1, the concentration of Na2S2O3 is constant, while the concentration of HCl is the independent variable.
Starting concentration of HCl = 2 mol dm-3
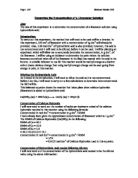
Experiment 2
Total volume = 75 cm3
In Experiment 2, the concentration of HCl is constant, while the concentration of Na2S2O3 is the independent variable.
Starting concentration of Na2S2O3 = 0.4 mol dm-3
Procedure
- Collect required equipment – a conical flask, three measuring cylinders, a piece of A4 paper, a marker pen, a stopwatch and beaker
- Draw a large cross in the middle of the piece of A4 paper using the marker pen, and place this directly beneath the beaker
- Accurately measure the following volumes in separate measuring cylinders:
-
50cm3 of Na2S2O3
-
1cm3 of HCl
-
24cm3 of H2O
-
Pour the measuring cylinder containing 1cm3 of HCl into the conical flask, followed by the measuring cylinder containing 24cm3 of H2O
-
Pour the measuring cylinder containing 50cm3 of Na2S2O3 into the beaker, followed by the conical flask containing the dilute HCl
- Immediately start the stopwatch
- Press the stop button on the stopwatch as soon as the cross disappears
- Write down this time then reset the stopwatch
- Pour the products in the beaker into a sink, then rinse the conical flask and beaker with tap water
- Repeat steps 3 – 9 to produce two more sets of results
- Repeat steps 3 – 10 for the different concentrations/volumes in Experiment 1 and Experiment 2
Analysing Evidence
Results
Experiment 1: Concentration of hydrochloric acid is variable; concentration of sodium thiosulphate is constant
Trial 1
Trial 2
Trial 3
Test 2: Concentration of sodium thiosulphate is variable; concentration of hydrochloric acid is constant
Trial 1
Trial 2
Trial 3
Average time taken in Experiment 1
Average time taken in Experiment 2
Calculating rate of reaction
As mentioned earlier, the rate of reaction is calculated by dividing the concentration of a species by the time taken for the cross to disappear. Below are these calculations:
Experiment 1
Experiment 2
Now that the initial rate of reaction at each concentration is known, the initial rate of reaction – concentration graph for each species can be constructed, and after this the order of reaction can be determined.
Interpreting initial rate of reaction – concentration graphs
As pointed out earlier in this coursework, the order of reaction for each species can be determined by comparing the initial rate of reaction – concentration graph with the three standard initial rate of reaction – concentration graphs, for the three different orders of reaction. Below are the conclusions:
Experiment 1
The curve produced is most similar to the second order graph. Therefore the concentration of HCl is of second order.
Experiment 2
The curve produced is most similar to the second order graph. Therefore the concentration of 223 is of second order.
Determining the rate equation
As the concentration of HCl and 223 are both of second order, the rate equation is the following:
Rate = k[HCl]2[Na2S2O3]2
Units of k
With the full rate equation known, the units of the constant k can be calculated:
Rate = k[HCl]2[Na2S2O3]2
mol dm-3 s-1 = k (mol dm-3)2 (mol dm-3)2
mol dm-3 s-1 = k (mol2 dm-6) (mol2 dm-6)
mol dm-3 s-1 = k (mol4 dm-12)
k = mol dm-3 s-1 / mol4 dm-12
Therefore, k = mol-3 dm9 s-1
Evaluation
I confidently believe that my initial prediction has been justified. From both initial rate of reaction – concentration graphs constructed for each experiment, it is obvious that as the concentration of the species increases, the rate of reaction also increases. The order of reaction in regard to each species has also been determined. However, I have experienced both procedural errors and errors in measurement. Below are these errors and ways in which I could overcome these if repeating the experiment:
Procedural errors
Errors in measurement
The main source of error in my investigation was obviously measuring the time taken for the cross to disappear. I found it difficult trying to start the stopwatch immediately after the reactants were mixed. Also, it was surprisingly a challenge to determine when the cross had completely disappeared as in some cases a small part of the cross was still visible from some angles. Although I feel that measurements taken have been quite accurate, these factors clearly affected the accuracy of my results.
In order to reduce the effect of all these errors, I would do the following if repeating this experiment:
- Have five trials instead of three – in order to produce more accurate average times
- Use different beakers for the reaction mixture if there was a greater amount of equipment available – in order to avoid effect of foreign ions
- Extensive cleaning of apparatus before use – the apparatus could have been contaminated before use which would produce inaccurate results