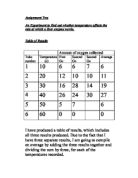
There is a clear pattern in the line-graph. As the temperature increases so does the amount of oxygen collected up until the temperature reaches 50ºc, then the amount of oxygen collected decreases to 0cm³.
By analysing the graph we can instantly see the most efficient temperature to use in order to break down hydrogen peroxide by the enzyme catalase in the liver to 40ºc. This is because 40ºc is the highest point in the graph, and this temperature has collected the most oxygen in a test tube.
By looking at the line-graph we can see that 10ºc and 50ºc collect the lowest amount of oxygen. We can notice this because 10ºc and 50ºc are the lowest point on the line-graph.
From these results we can write a conclusion and compile a scientific knowledge of Human Physiology and Health to make the experiment more clear and accurate.
Conclusion
In drawing together a conclusion for the investigation of whether temperature affects the rate of reaction, we can see from the table of results and line-graph that when the temperature increases to a certain degree (50ºc) the amount of oxygen collected increases. This is because kinetic energy within the particles increases, therefore more pairs of particles will have enough energy between them to collide successfully and break apart.
Enzymes are biological catalysts. They are produced in all living organisms and control all the chemical reactions that occur. Enzymes are held by chemical bonds. If you increase the temperature, the chemical bonds begin to break in the molecule due to kinetic energy.
This makes the enzyme lose its shape and structure, it then begins to denature. When the enzyme denatures it cannot perform the required instructions and dies. We can see this in the line-graph for 50ºc. The amount of oxygen collected is 6cm³, which is hardly enough compared to the other amounts of oxygen collected for different temperatures.
We can also see that temperature 10ºc the amount of oxygen collected is 6cm³ which is also very low. This is because at low temperatures enzymes work very slowly, causing fewer reactions to take place.
From looking at the line-graph we can see that the amount of oxygen collected stopped at 60ºc. This reflects the fact that the enzyme has denatured and can no longer function (fit into substrate).
The enzyme will denature after 40ºc and any other temperature above that. Reason being, is that enzymes are proteins and their structures are three dimensional. If you increase the temperature, the shape alters resulting in a denaturising enzyme.
We can see that the best temperature to use is 40ºc, because the average body temperature is 37ºc, resulting in enzymes which can breakdown hydrogen peroxide to water and oxygen efficiently.
Evaluation
I think the results the individual achieved are adequate. It is good that the individual repeated the experiment three times, but did not achieve any results on the third go for temperatures 40 and 50ºc. But I believe there is enough evidence to support my conclusion.
Even though the individual did not achieve any results for temperatures 40 and 50ºc on the third go, we can still rely on the results because they show the general pattern for each amount of oxygen collected.
Repeating the experiment three times made the results more reliable.
There is only one anomalous point (50ºc), this is due to the fact that the enzyme denatured and no oxygen was being collected into the test tube.
The experiment could have been more accurate by:
- Keeping the temperature at a constant level. It could have been that the temperature went higher or lower than the required amount.
- Making a more accurate reading on the measuring cylinder.
- Placing the apparatus more correctly.
The evidence is thus enough to draw a conclusion on whether ‘temperature affects the rate at which a liver enzyme works,’ enough to say that the best temperature for an enzyme to work 40ºc and anything below that will be too slow and anything above will denature the enzyme.
Overall the experiment was correct. However at the same time, more repetitions of the experiment would make the results even more reliable. Not only repetitions at one point in time but repetitions over a number of weeks to make sure those factors such as temperature, equipment and inaccurate readings do not interfere with the results.
Repeating the experiment over time will take this into account. After having done the experiment a graph of means can be worked out bringing a pool of evidence together to draw a tight conclusion.