An Experiment to investigate the factors that affect the Power Output of a solar (photovoltaic) cell.
An Experiment to investigate the factors that affect the Power Output of a solar (photovoltaic) cell
Aim
There are many factors that influence the power output of the solar cell. The aim of this investigation is to understand and determine how two different variables will affect the solar cells overall power output. The data that will be collected should show the relationship the two factors have in comparison to the power output of the solar cell. Solar cells are essentially controlled by light, and so the aim is to see what effect light has on the power output of the solar cell as its distance from the light increases (i.e. as it gets less light).
By using the results and producing graphs it will be possible to make conclusions as to what the main influencing factors are on the overall power output of the solar cell. By the end of this investigation, this should produce a clear understanding as to what effect those factors have on the power output.
Method
There are many different factors that affect the power output of solar cells. The aim of this experiment is to discover these factors. There will be two variables being investigated in this experiment. These are:
. The effect on the power output of a solar cell as its distance from the light bulb increases.
2. The effect on the power output of a solar cell with a red, yellow and green filter covering it, as its distance from the light bulb increases.
In the first experiment, investigating the power output of the solar cell as its distance increases from the light will show whether or not more light (when the solar cell is closest to the light) produces a higher power output in the solar cell. In the second experiment, investigating the power output of the solar cell with coloured filters in front of them will show if different coloured filters in front of the solar cell will have a significant effect on the overall power output of the solar cell, therefore determining which colour allows the most light to be absorbed by the solar cell.
The Apparatus Required:
* A Voltmeter
* An Ammeter
* A Solar Cell
* Crocodile clips (wires)
* A 12 Volt Light Bulb
* A 10 ohm fixed resistor
* A Battery for the lamp
* A 1 meter ruler
* A Yellow, Red and Green coloured filter
Steps to Perform the Investigation
. The first step is to connect the two circuits, and to ensure that they are connected properly. The vital thing to remember is that the ammeter must be connected in series and the voltmeter must be connected in parallel to the circuit with the solar cell.
2. This is a diagram of the two circuits that have to be made:
3. As you can see from the diagram, the voltmeter and the ammeter are connected to the solar cell in one circuit, with a 10-ohm resistor, whilst the 12-volt bulb is connected with the battery in the other circuit. This is a picture of how the voltmeter and ammeter must be connected
4. To investigate the first variable:
* The ruler must be laid out in a straight line from the light bulb.
* The solar cell should then be moved by a factor of 2cm, starting from 0cm (which is directly in front of the light bulb), up to 100cm (1 meter away from the bulb). For example, a reading must be taken at 0cm, 2cm, 4cm, 6cm, etc. The readings should be read from the ammeter and the voltmeter, which are connected to the solar cell.
* These results should be recorded in a table.
5. To investigate the second variable
* The ruler must be laid out in a straight line from the light bulb.
* A red filter should be placed in front of the solar cell.
* It should then be moved by a factor of 5c, starting from 0cm (which is directly in front of the light bulb. For example, a reading must be taken at 0cm, 5cm, 10cm, 15cm, etc. The readings should be read from the ammeter and the voltmeter, which are connected to the solar cell.
* These steps are then to be repeated using a green filter, and then a yellow filter.
Safety Precautions:
* Be careful with the light bulb. It is likely to be very hot so do not let it touch your body. If necessary, move it holding its base, and not from the top.
* Keep your fingers away from the power source. Use the equipment very carefully as electricity can be dangerous. Act responsibly with the equipment, and do not mess around with it, as the consequences in terms of injuries can be severe.
To ensure that the results collected are accurate and fair, it is important to make sure that everything is kept constant except the variable itself. The same solar cell must be used each time, as solar cells of different sizes tend to absorb different amounts of light. It is important to turn of the main light in the room, as this would provide inaccurate results. The entire experiment should be done in the same room, using the same light bulb each time; as if it is different it could have an effect on the final results. While collecting the results, it is vital to make sure that there is nothing between the lamp and the solar cell. After moving the solar cell each time to a greater distance, wait a few seconds before taking down the results, as it normally takes some time for the ammeter and voltmeter to measure the new current and voltage being produced, and settle down.
The formula for power is P=I * V (power = voltage x current). Therefore, after taking the measurements as stated above, it is possible to calculate the total power output of the solar cell. Graphs can then be made to illustrate these results, with the distance on the x-axis and the power output on the y-axis. This will depict their relationship (i.e. whether they are proportional, inversely proportional, or inversely squared proportional).
Hypothesis
From the research I have done, I can predict that as the solar cells distance from the light bulb increases, the amount of light energy it will convert into electrical energy will be low, thus it will produce a low current and voltage, so it will therefore have a low power output. This is because when the solar cell is further away from the light, the light rays have to spread out more to reach it, so less light will reach the solar cell. When it is closer to the light, it will gain more light energy, because the light spreads less, so it will therefore have a high power output in that case.
In effect, I think that the distance will be inversely proportional to the power produced. I can predict that when a red coloured filter is put on the solar cell, the most light will be absorbed because red is effectively a dark colour, so all the light that approaches the it will be absorbed except red light itself, of which there is probably going to be none in this experiment. I think that when a green coloured filter is put on the solar cell, the least amount of light will be absorbed by the solar cell, because most of the light coming from the bulb will be of a similar colour, and therefore only some of it is likely to be absorbed, whilst the rest is reflected. I think that the yellow filter will have a power output moderately between the power output with the red filter and the green filter, as it is a relatively light colour compared to the other two colours, and most of the light coming from the light bulb will not be yellow, so more light is likely to be absorbed than reflected by the solar cell. These are my predictions based on the research I have done, and I will investigate whether they are accurate.
Introduction
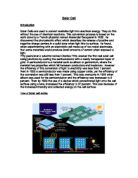
What are Solar Cells?
A solar cell is an electrical power supply. It follows the same concept as a battery. These cells are essentially converters that use one form of energy (light), and convert it into another form (electricity). However, when it does not get the light form of energy, if for example it is completely dark, the conversion process slows down and eventually stops. Solar cells do not store electricity; they only convert it when light is available. They perform the conversion without moving any parts, without any noise, pollution, radiation or maintenance. Solar ...
This is a preview of the whole essay
Introduction
What are Solar Cells?
A solar cell is an electrical power supply. It follows the same concept as a battery. These cells are essentially converters that use one form of energy (light), and convert it into another form (electricity). However, when it does not get the light form of energy, if for example it is completely dark, the conversion process slows down and eventually stops. Solar cells do not store electricity; they only convert it when light is available. They perform the conversion without moving any parts, without any noise, pollution, radiation or maintenance. Solar cells are also known as photovoltaic cells (photo=light, voltaic=electricity), so they convert light directly into electricity. This process is known as the photoelectric effect.
What are they made up of?
The most common solar cells are made up of silicon, which is a semiconductor material, so it has the properties of both, a metal and an insulator. Atoms in a semiconductor material bind their electrons tighter than metals but looser than insulators. The energy absorbed by the solar cell is therefore transferred to the semiconductor material. An atom of silicon has 14 electrons, arranged in three shells. The first two shells are completely full, whilst the outer shell is only half full with four electrons. For this reason, silicon tends to share electrons with four of its neighbour silicon atoms. That is how its crystalline structure is formed, which is a vital part of solar cells. In this form, silicon is a poor conductor. However, impurities can be added to it to alter this characteristic.
When energy is added, in the form of light, a few electrons break free of their bonds and leave their atoms, leaving a hole behind. They move around randomly looking for other holes they can go into. These electrons are known as 'free carriers', and they often carry an electrical current. However, impure silicon with phosphorous atoms mixed in it, is different. It requires less energy because the bonds are much weaker. As a result, the electrons break free more easily and there are more 'free carriers' available. This process of adding impurities is known as 'doping'. When silicon with phosphorus atoms mixed in it, is bonded to silicon, the product is known as the N-type silicon. It is negatively charged, and it is a much better conductor than pure silicon. The other part of the cell is known as the P-type. This is silicon with boron atoms mixed in it, bonded with silicon.
Rather than having free electrons like the N-type silicon, it has free holes, which effectively means that there are fewer electrons, so it carries a positive charge.
Initially the silicon is neutral. However, when the N-type and the P-type silicon meet, they lose their neutrality. This is because the N-type silicon has loose electrons finding holes, and the P-type silicon has the holes that the electrons are looking for. So the two types mix at the junction in between, forming a sort of barrier, which makes it more difficult for the electrons on the N side to move to the P side. When equilibrium is finally reached, an electric field is produced. The electrical field acts as a diode. Another circuit is required so that the cells can give off a current, to allow the electrons to pass through the 'load' in between to go into the holes in the P-type silicon.
How do they work?
Light is made up of photons. The amount of energy they consist of varies, depending on their wavelength. When photons hit a solar cell, they are either reflected, absorbed or they may pass through it. Antireflective coating is often applied to the cell to reduce the reflection loss. It is only the absorbed photons however, that produce electricity. When this takes place, the energy produced from the photons is moved to an electron in the atom of the cell (it is a semiconductor material). With this new energy, the electrons can move from its normal position to join the current in an electrical circuit because they are ionized by the energy. When light hits the cell, electrons are knocked free from the crystal lattice. The free electrons move toward the positively-charged n-type layer, creating a current. The current closes through a circuit and returning electrons fill the empty holes holes.
Upon leaving its normal position, the electrons result in a "hole" being formed, and they can move freely in a particular direction. It is the electrical properties of the solar cell (a built in electrical field) that gives the necessary voltage required to move the current through an outside load, such as a light bulb. Some solar cells however, may have more than one electrical field and they operate to free the electrons when light is absorbed. A current is a flow of electrons, and the electric fields create a flow of electrons, and so a current is produced this way. By placing metal contacts on the top and bottom of the solar cell, the current can be drawn out for external use.
The Factors that Affect the Power Output of a Solar Cell
* Light Intensity: The amount of light produced from a source has an effect on the overall power output produced from the solar cell. A bright light will give more light energy to the solar cell compared to a dim light, and so as a result, the solar cell close to the bright light will have a higher overall power output. So the more light there is, the higher the power output of the solar cell is likely to be.
* Distance of the Solar Cell from the Light Source: The distance of the solar cell from the light source will have an effect as to what its overall power output will be. The further away the solar cell is from the light source, the lesser light energy it will capture, because the light rays have to spread out over a much larger area, so therefore it will receive less light and its power output will be low. This signifies that the surface area of the solar cell receiving the light decreases in proportion to the amount of light it receives. On the other hand, the closer the solar cell is to the light source, the more light energy it will be able to capture, as the light rays will not spread out as much, therefore more current will be produced, so its power output will be high. This factor is linked to the light intensity given to the solar cell.
* The Surface Area of the Solar Cell: This is an important factor that influences the final power output of the solar cell. This is because, as it may be obvious, cells with a larger surface area have a higher area to receive more light energy in a given time, so they will therefore produce more electricity, producing a much higher current (and therefore a high power output) compared to smaller cells, which will not be able to capture as much light in the same amount of time because they have a much smaller area, and therefore less room to receive a sufficient amount of light. They will convert less light energy into electrical energy, producing a much smaller current. This therefore implies that cells with a larger surface area will have a much greater power output compared to cells with a smaller surface area, which will have a significantly low power output. Also, The type of material the solar cell is made up of can have an effect on its overall power output. This is because, amorphous silicon solar cells for example, have an efficiency of about ten percent, while polycrystalline solar cells have an efficiency of about twenty percent. This tends to vary.
* Improper wiring: Electrical circuits made poorly tend to create resistance, resulting in a lower power output. So it is essential to ensure that everything is clean and connected tightly, in the correct places as this will provide maximum efficiency.
* The Angle of the light facing the Solar Cell: The angle the light approaches the solar cell may have a significant effect as to how much light energy it can receive. Solar cells essentially receive the most light, and therefore have the highest power output when they are facing directly towards the light source. Only the light that is absorbed can be use to produce electrical energy in the solar cell. However if a solar cell is not directly pointed at the light source, some of the light may be reflected off the square of the cell and therefore lost. So certain angles help solar cells give a higher power output (this is when most of the cells face the light source), whilst other angles reduce the overall power output (this is when most of the cells face away from the light source). Basically, if the angle of the light is bigger than the critical angle, it will be reflected and therefore lost. So this may have a great effect as to how much light the solar cell will actually receive.
* Wavelength of light: Light has different types of wavelengths. Since the amount of energy they consist of varies, some photons may not have enough energy to form an electron-hole pair. They just pass through the solar cells, having no effect whatsoever. However, if it has too much more energy than required, the extra energy is lost. So a sufficient amount of light energy can be lost as result of this factor.
Results
Results from the First Variable: The Effects of the power output of the solar cell as
its distance from the light bulb increases
Distance From the Bulb (cm)
Voltage (mV)
Current (mA)
Power output of solar Cell (mW)
0
420
42.1
7682
2
403
40.6
6361.8
4
388
39
5132
6
364
36.5
3286
8
333
33.5
1155.5
0
305
30.6
9333
2
276
27.7
7645.2
4
242
24.5
5929
6
218
21.9
4774.2
8
94
9.6
3802.4
20
74
7.6
3062.4
22
60
6.2
2592
24
42
4.6
2073.2
26
30
3
690
28
13
1.4
288.2
30
04
0.6
102.4
32
91
9.3
846.3
34
85
8.5
722.5
36
76
7.9
600.4
38
71
7.2
511.2
40
67
6.8
455.6
42
61
6
366
44
57
5.7
324.9
46
52
5.2
270.4
48
49
4.9
240.1
50
46
4.7
216.2
52
40
4
60
54
38
3.8
44.4
56
37
3.7
36.9
58
35
3.5
22.5
60
33
3.3
08.9
62
31
3.1
96.1
64
30
3.2
96
66
28
2.8
78.4
68
28
2.8
78.4
70
26
2.6
67.6
72
25
2.5
62.5
74
24
2.4
57.6
76
23
2.4
55.2
78
21
2.1
44.1
80
21
2.1
44.1
82
20
2
40
84
9
.9
36.1
86
9
.9
36.1
88
8
.8
32.4
90
7
.7
28.9
92
6
.6
25.6
94
6
.6
25.6
96
5
.5
22.5
98
5
.5
22.5
00
5
.5
22.5
When the light was at 0cm away from the light bulb, the power output was the highest, at 17,682 milliwatts. When the light was 30cm away, the power output was 1,102.4 milliwatts. When the light was 90cm away, the power output was 28.9 milliwatts. This graph therefore shows that as the distance of the light increases, the total power output of the solar cell decreases. As described in the introduction, this is because the light rays have to spread over a much wider area if the light is far from the solar cell, so some of the light rays may be lost to the surroundings and only part of it reaches the solar cell. Therefore, only a few of the initial light rays given out by the light can be converted into electrical energy. This graph depicts that the distance of the light and the power output of the solar cell are not proportional, as there is not a straight line, it is a curve. So this graph effectively shows that my predictions were correct in saying that as the distance of the light bulb increases, the power output of the solar cell decreases.
Results from the Second Variable: The effect of the power output of the solar cell when a green filter is placed in front of it as its distance
increases from the light bulb
Distance from the light (cm)
Voltage (mV)
Current (mA)
Power output of the solar cell (mW)
0
399
40.1
5999.9
5
271
27.3
7398.3
0
72
7.3
2975.6
5
14
1.5
311
20
80
8
640
25
57
5.7
324.9
30
40
4
60
35
33
3.3
08.9
40
27
2.7
72.9
45
23
2.3
52.9
50
9
.9
36.1
55
6
.7
27.2
60
4
.4
9.6
65
2
.3
5.6
70
2
.2
4.4
75
0
.2
2
80
9
0.9
8.1
85
8
0.8
6.4
90
7
0.7
4.9
95
7
0.7
4.9
00
6
0.6
3.6
When the bulb was at 0 cm away from the solar cell, the power output of the solar cell was 15,999.9 milliwatts. When the bulb was at 50 cm away, the power output of the solar cell was 36.1 milliwatts. When the bulb was 90 cm away from the solar cell, the power output was 4.9 milliwatts. There is an obvious decrease. These results therefore illustrate that as the distance of the solar cell increases from the light bulb, the power output of the solar cell decreases. As mentioned before, this is because the light is spread over a wider area when it is further away from the solar cell, so therefore not all of the rays reach the cell, and only a fraction of them are absorbed. Because a green filter was placed in front of this solar cell, these results show that the green filter resulted in less light rays getting to the solar cells compared to when there was no filter. This is because, on the previous graph, when there was no coloured filter in between the light and the solar cell, more light approached the solar cell. For example, when there was no coloured filter, at 0 cm, the power output was 17682 milliwatts. It was 15999.9 milliwatts with a green filter at the same distance. At 50 cm away, when there was no coloured filter, the power output was 216.2 milliwatts. It was 36.1 milliwatts with the green filter at the same distance. These differences are very significant.
At 100 cm, when there was no coloured filter, the power output was 22.5 milliwatts, and it was 3.6 milliwatts when there was a green coloured filter. So this shows that although the investigation involving the green filter followed the same pattern as the investigation without any filters (i.e. the first variable), some light may have been reflected off the filter and so less light reached the solar cell. I will now investigate whether the red filter in front of the solar cell follows the same pattern.
Results from the Second Variable: The effect of the power output of the solar cell when a red filter is placed in front of it as its distance
increases from the light bulb
Distance from the light (cm)
Voltage (mV)
Current (mA)
Power output of the solar cell (mW)
0
427
43
8361
5
357
35.9
2816.3
0
268
26.9
7209.2
5
19
9.1
2272.9
20
36
3.7
863.2
25
03
0.3
060.9
30
77
7.8
600.6
35
60
6
360
40
48
4.9
235.2
45
40
4
60
50
33
3.3
08.9
55
28
2.8
78.4
60
24
2.4
57.6
65
21
2.1
44.1
70
9
.9
36.1
75
7
.7
28.9
80
5
.5
22.5
85
4
.4
9.6
90
3
.3
6.9
95
2
.2
4.4
00
0
0
When the solar cell was 0 cm away from the light, its power output was 18361 milliwatts. When it was 40 cm away, its power output was 235.2 milliwatts. When it was 100 cm away from the light, its power output was 10 milliwatts. Again, it follows a similar pattern as the previous two investigations, in that as its distance from the light increase, its power output decreases because the light rays have to spread over a much wider area, so not all of the rays reach the solar cell. This has been explained before. The results show that in general, the red filter allowed more light to reach the solar cell, compared to the green filter, but it allows less light to get through compared to the solar cell without any coloured filter.
For example, when the solar cell was 50 cm away from the light, the power output for the cell with the green filter was 36.1 milliwatts, it was 108.9 milliwatts for the cell with the red filter, and it was 216.2 milliwatts for the solar cell without any coloured filter. That is the pattern. When it was 80 cm away from the light, the solar cell with the red filter produced a power output of 22.5 milliwatts, the solar cell with the green filter produced a power output of 8.1 milliwatts and the solar cell without any filter produced a power output of 44.1 milliwatts. When it was 100 cm away from the light, the solar cell with the red filter produced a power output of 10 milliwatts, the solar cell with the green filter produced a power output of 3.6 milliwatts and the solar cell without any filters had a power output of 22.5 milliwatts, again showing that the solar cell without any filter allowed to reach it, absorbing it, whilst more light was reflected or lost off the solar cells with the green and red filters on them. However, it appears that red filter allows more light to be absorbed compared to the green filter. I will extend this investigation by further by determining how high the power output is when a yellow filter is placed in front of the solar cell.
Results from the Second Variable: The effect of the power output of the solar cell when a yellow filter is placed in front of it as its distance
increases from the light bulb
Distance from the light (cm)
Voltage (mV)
Current (mA)
Power output of the solar cell (mW)
0
420
42.2
7724
5
339
34.1
1559.9
0
251
25.2
6325.2
5
85
8.6
3441
20
37
3.8
890.6
25
03
0.3
060.9
30
79
7.9
624.1
35
62
6.2
384.4
40
50
5.1
255
45
42
4.2
76.4
50
35
3.5
22.5
55
31
3.1
96.1
60
26
2.6
67.6
65
23
2.3
52.9
70
20
2
40
75
8
.8
32.4
80
7
.7
28.9
85
5
.5
22.5
90
4
.4
9.6
95
3
.3
6.9
00
2
.2
4.4
When the solar cell was 0 cm away from the light in this case, the power output was 17724 milliwatts. It was 122.5 milliwatts when the solar cell was 50 cm away from the light bulb, and it was 14.4 milliwatts when the solar cell was 100 cm away from the light. These results again show the same general trend that as the distance increases, the power output of the cell decreases. The reason as to why this happens was mentioned previously. From all of these results, it appears that the solar cell (Pv cell) with no coloured filter allowed the most light to be absorbed, so therefore it had the highest power output. The solar cell (Pv) with the red filter had the second highest power output, the solar cell (Pv) with the yellow filter had the third highest power output and the solar cell (Pv) with the green filter had the lowest power output.
On a rainbow, out of the three coloured filters used in this investigation, red is the outermost layer. Yellow is in between, and green is the innermost layer. It may be that the solar cell received more green light than red or yellow light, so more green light was reflected, and therefore not much of it was converted into electrical energy, so there was a low power output. Red is a dark colour, so it is likely that most of the light given off the bulb was absorbed by the solar cell, and not reflected. Some of the light may have been yellow, and so some if it was reflected, whilst the rest of it (the light that was not yellow) was absorbed, thus converted into electrical energy. That is likely to be the reason for these results.
This graph is useful to compare the total power output of the three solar cells. It shows that the solar cell with the red filter produced the highest output, the solar cell with the yellow filter produced the second highest output and the solar cell with the green filter produced the lowest power output. In all of the graphs that have been drawn so far, there is no straight line so the distance of the solar cell does not seem to be proportional to its power output. To create a better understanding of what their relationship really is, I will now draw a graph for each variable with the x-axis as 1/distance, and the y-axis as the power output of the solar cell, so as to investigate whether or not they are inversely proportional.
This graph does not produce a straight line. Instead, it shows a curve opposite to the curves drawn previously. It is therefore evident that the relationship between the distance and the power output of the solar cell is not inversely proportional in this case. It follows the same pattern as the graphs with just distance at the x-axis, except for the fact that is exactly the opposite. Although the graphs for the coloured filters are likely to follow the same pattern, I will draw them to ensure that the relationship of the distance is not inversely proportional to the power output of the solar cell.
Again this graph is exactly the opposite of the graph drawn for the solar cell with a green filter, with distance on the axis. This therefore proves that the distance is not inversely proportional to the power output of the solar cell with the green filter. I will now draw the same graph for the solar cell with the yellow filter, to see if that too follows the same concept.
Like the other graphs, this graph does not show a straight line, therefore signifying that the power output of the solar cell and its distance from the light are not inversely proportional. Just as I would have expected it to be, this graph is exactly the opposite, with the graph in which it was just the distance on the x-axis. Finally, I will draw a graph for the red filter, with the x-axis as 1/Distance, to see if there is any sign of proportionality in its case, but I can predict beforehand that it will follow the same concept as this graph.
This graph follows the same pattern as the other graphs drawn, and so it is possible to conclude that the solar cells distance from the light is neither proportional, nor inversely proportional to its power output. To expand this investigation further, I will now investigate whether they are inversely squared proportional. To do this, I will make the x-axis 1/d², and the y-axis will stay as the power output of the solar cell.
Although the line on this graph is relatively straight to begin with, there is obviously a curve. For this reason, it seems as if the distance of the solar cell from the light and its power output are not inversely squared proportional. However, some of the results collected may have anomalous. This graph is extremely similar to the graph made of the same data when the x-axis was 1/distance. I will now draw a graph for the results collected from the green solar cell, to determine whether or not the relationship between the solar cell's distance from the light and its power output is inversely squared proportional.
The line on this graph is evidently relatively straight, illustrating that the power output of the solar cell is in fact inversely squared proportional to its distance from the light. This basically means that if the solar cells distance from the light source is doubled, its power output drops by a quarter of its original power output. If the distance is tripled, the power output drops by a ninth. If the distance is quadrupled, the power output drops by a sixteenth. That is the relationship I have discovered between the power output of the solar cell. I will now investigate whether the solar cell with the yellow filter follows the same pattern.
The line on this graph is relatively straight. Although it is not exactly straight, this is probably because there may have been a few anomalous results, and the results were not necessarily collected at maximum accuracy. So it is a fairly straight line, which illustrates the relationship between the solar cells power output and its distance from the light: they are inversely squared proportional. I will now draw the same graph for the results collected from the solar cell with the red filter, to investigate whether it follows the same concept.
This graph again shows a relatively straight line though because of a few anomalous results, it is not entirely straight. As in the graphs for the solar cell with the green filter and yellow filter, this graphs shows that the distance of the solar cell is basically inversely squared proportional to the power output of the solar cell. As mentioned earlier, this means that if the distance is doubled, the power output is reduced by a quarter. If the distance is tripled, the power output is reduced by a ninth. If the distance is quadrupled, the power output is reduced by a sixteenth.
I have therefore determined the relationship between the distance of the solar cell and its power output. It is inversely squared proportional. The formula that illustrates the relationship between the power output of the solar cell and its distance from the light is: P=1/d², with P being power and d being the distance from the solar cell.
Evaluation
In general, this was a very successful investigation. The two variables that I measured proved to be an accurate way of measuring the overall power output of the solar cell, and there was an obvious difference in the results I collected. From my results, it was possible to establish a relationship between the current in the solar cell (therefore its power output) and its distance from the solar cell.
My results seem to be fairly accurate. When I was doing the investigation, the ceiling light was turned off, and so effectively, the light was coming from my light bulb only. This makes my results more reliable. The graphs I made illustrate my results very well. The only graph in which the results seemed slightly anomalous was the graph of the solar cell without any coloured filter, when 1/d² was on the x-axis. The graph shows a curve, though it should have been a straight line. This is because in all of the other graphs for that particular category, the graph showed a relatively straight line. For that particular investigation, I took measurements at intervals of 2cm, whilst I took measurements in intervals of 5cm for the other experiments, so that may have had an effect on the reason for the curve, as the data is much more spread out compared to the other graphs.
Ways to Improve the Experiment
One way to improve this investigation would be to do it alone in one room. When doing it this time, there were several other people doing the same investigation in the same room and so their light bulb may have had an effect on the power output of the solar cell I was using. Light may have been coming from the room next door as well, providing more light energy, which increases the power output of the solar cell. So it is important to ensure that there is no background light when performing this investigation.
Another way to improve my results is to firmly ensure that nothing blocks the light rays from entering the solar cell. My tie often came in between the light and the solar cell, and people were walking around frequently in the room, so that may have had a significant effect on the light rays reaching the solar cell, and therefore on the overall power output of the solar cell.
Time was limited in doing this experiment, so therefore it had to be carried out at a fairly rapid pace. The current and voltage displayed on the ammeter and voltmeter often changed after a while. Another way to improve this experiment would therefore be to keep the solar cell at each distance from the bulb for a few minutes, while the readings on the voltmeter and ammeter settle down. This would provide more accurate results.
In this investigation, I began my measurements from 0cm and moved on until I reached 100cm. However, to improve my results, I would start from 100cm and move down to 0cm. This is because at 0cm, the voltage and the current is the highest, and so this may have had an effect on the power output throughout the entire experiment. It is better to start from by getting a low power output and watch it increase.
To Expand This Investigation:
Although this was a comprehendible and accurate investigation, it did not cover every aspect of measuring how the power output of a solar cell is affected. More experiments can be done to create a better understanding of what factors really do affect the power output. To extend this experiment, solar cells of different sizes could be used to see how their size or surface area is related to their power output. Different types of solar cells could be used. The angle of the light source in front of the solar cell could be altered. A bigger light source could be used. The distance of the solar cell from the light bulb could be increased, i.e. in this experiment I only took measurements up till 1 meter away from the bulb, so I could take measurements up to about 2 or 3 meters for more accurate results.